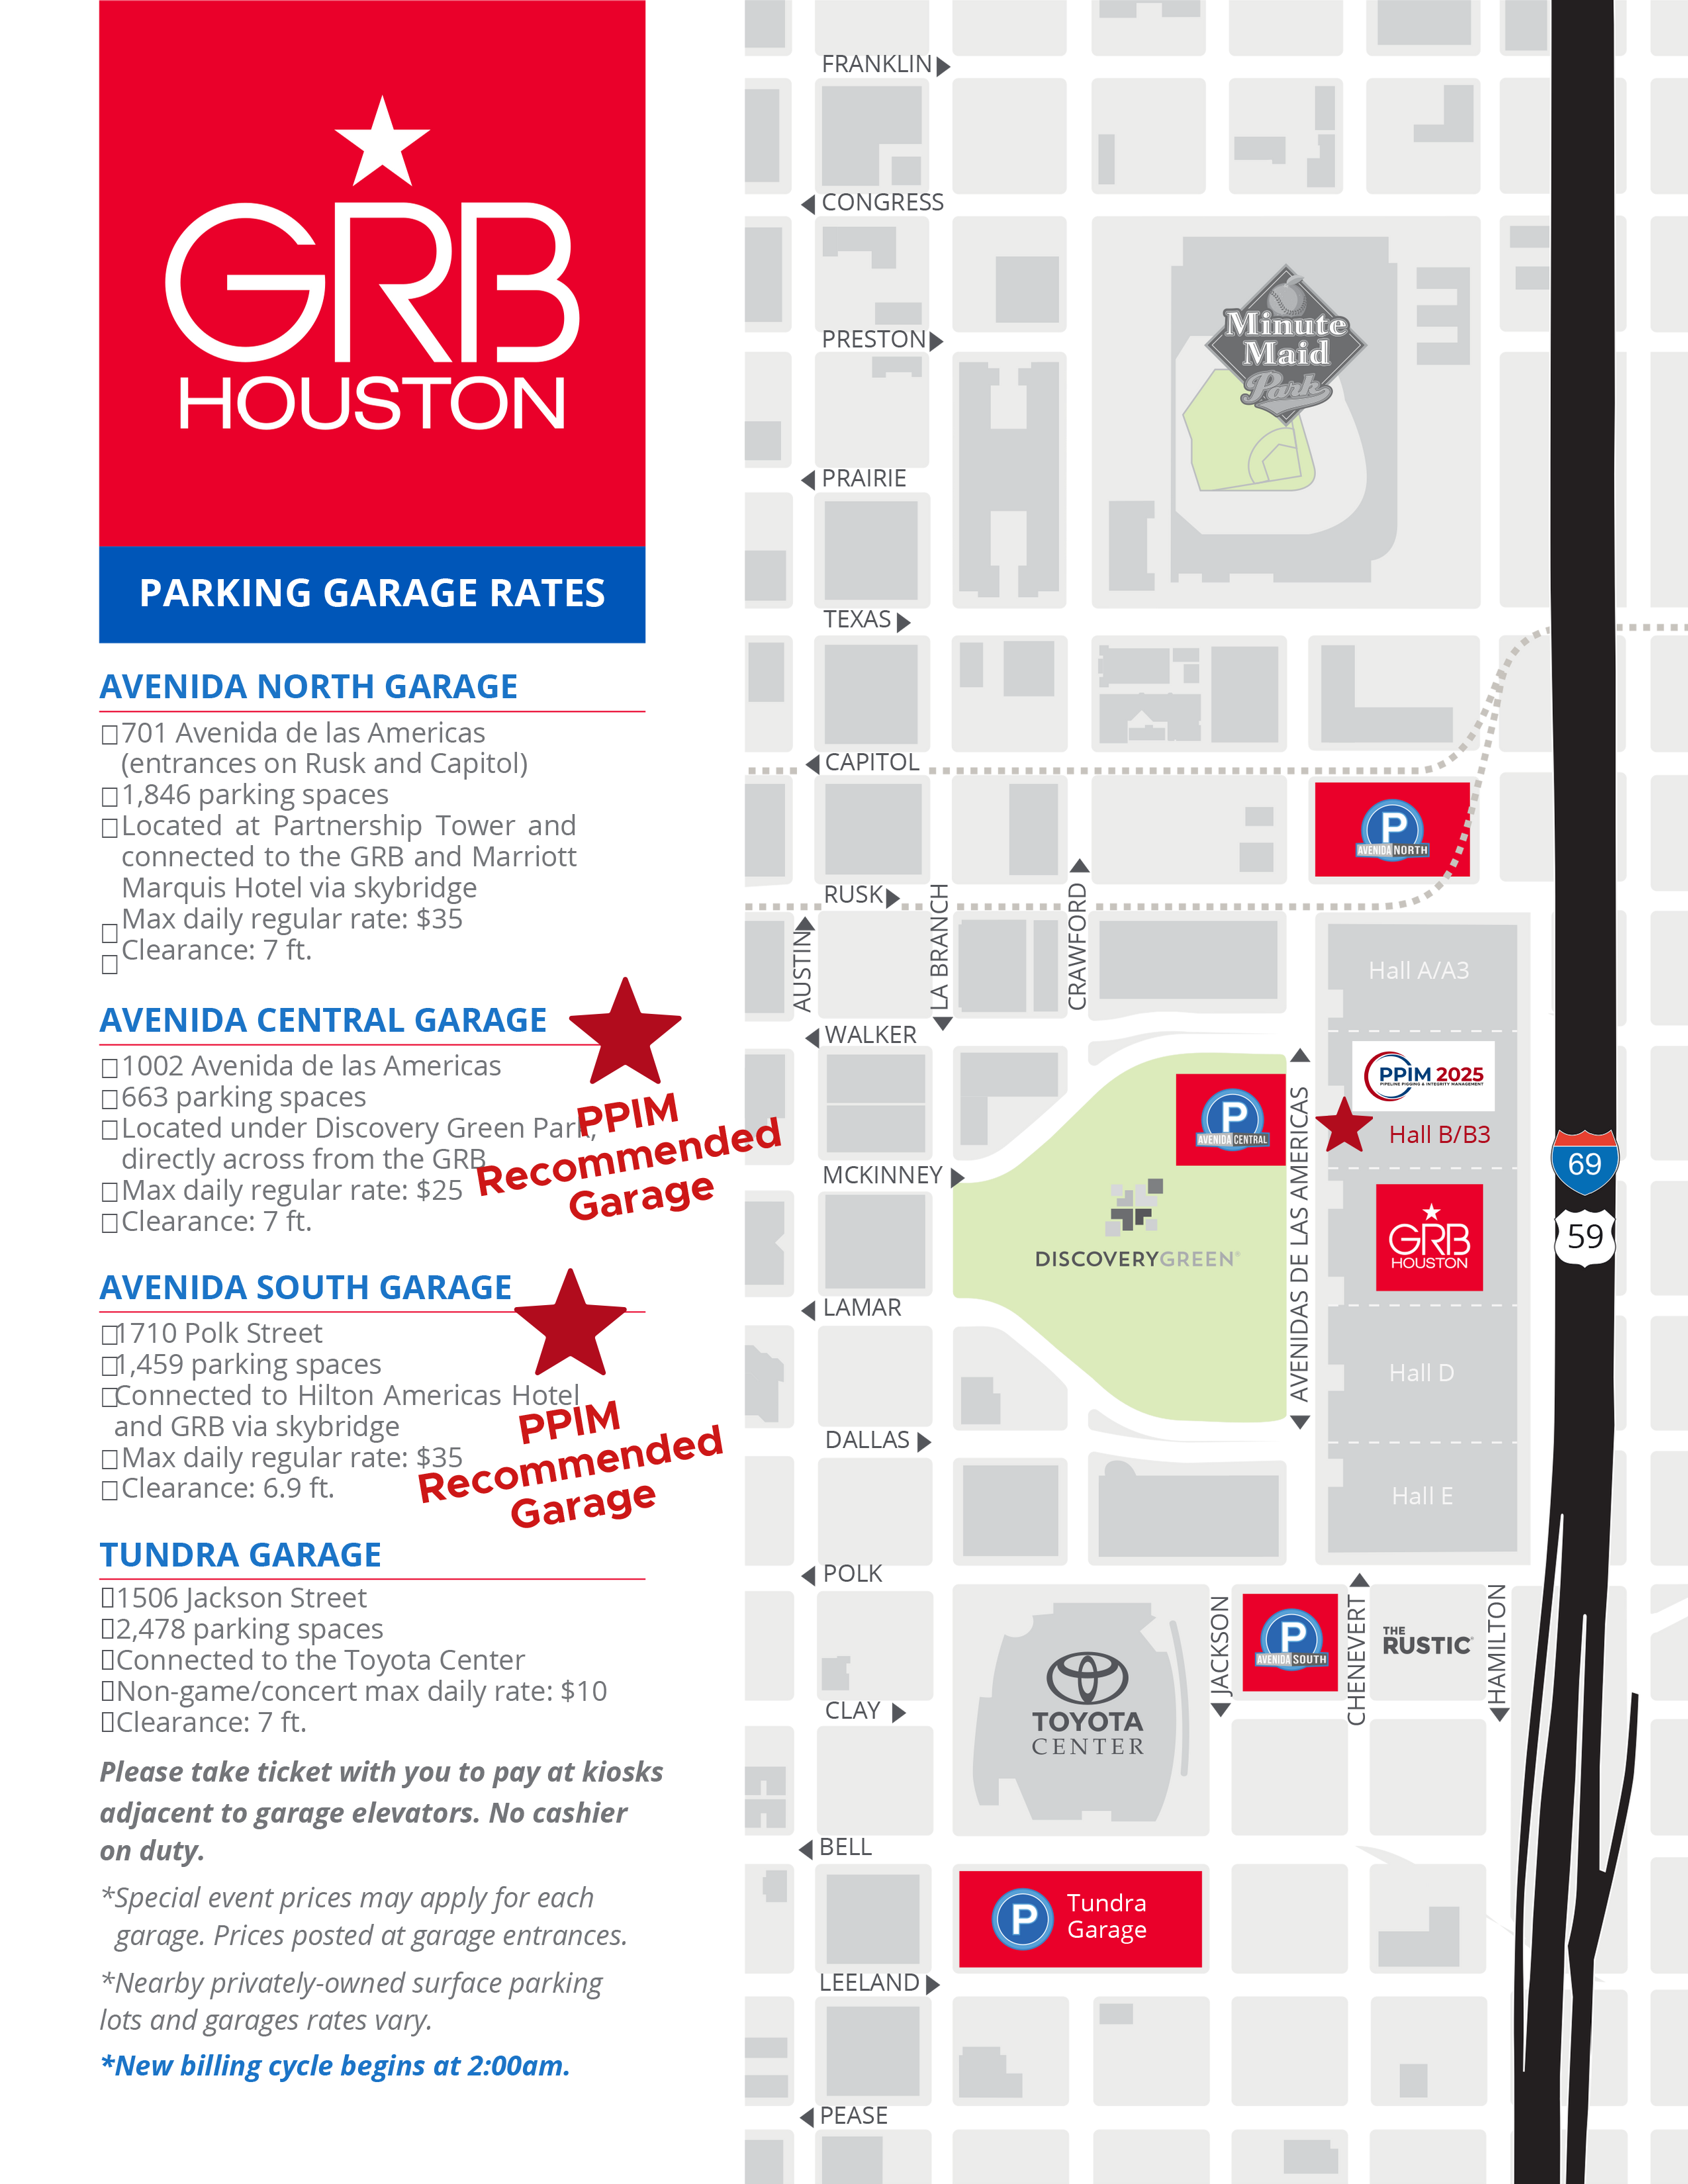
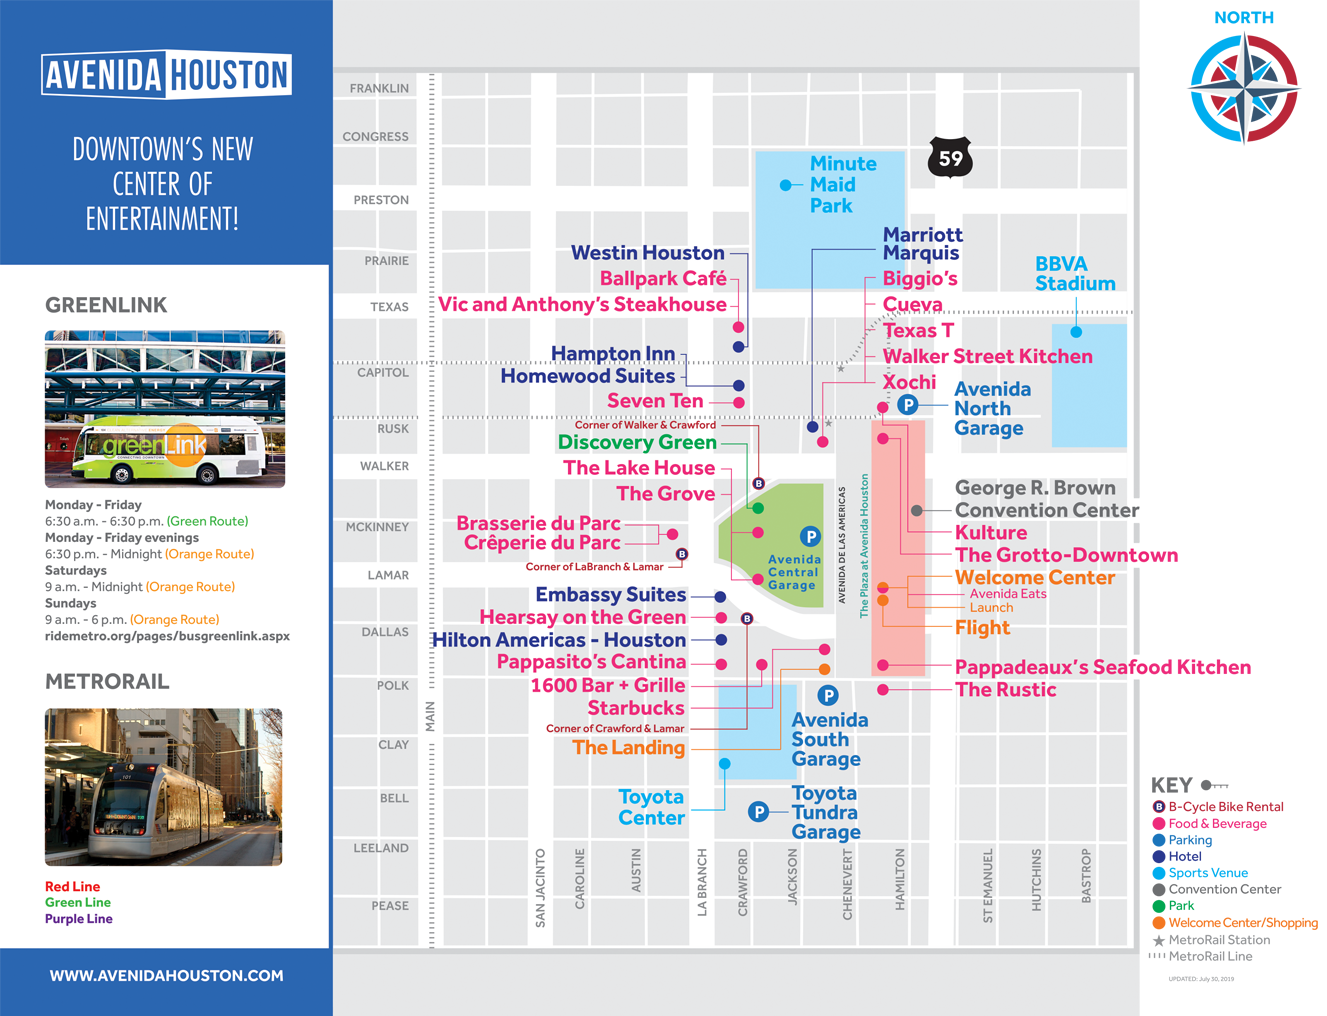
1. PHMSA Updates Related to Data and GIS
1PODS Association, Houston, USA. 2PHMSA, Washington DC, USA
Abstract
PHMSA Updates Related to Data and GIS
Did you know that the NPMS system uses the PODS model? So, if you have ever uploaded your NPMS submittal you have used PODS! PHMSA has been a member of PODS for over a decade now in fact, so the PODS Association works closely to make sure that all data tables and schema are standardized for use by all operators and service companies that support them. The PODS Model is operator designed to comply with regulations, support specific pipeline operations and decrease risk through digital twin/asset knowledge management.
Joining PPIM in-person will be Leigha Gooding, PHMSA OPS GIS Manager and Monique Roberts, PODS Executive Director. Leigha manages the NPMS system so we will hear first hand on regulation, data and GIS.
This presentation will cover a high-level overview of the NPMS submittal process, the radical increase in segmentation and new attributes that PHMSA is expecting operators to capture as well as some news from the PODS Community and the recent ILI module release on PODS 7.
- High level overview of NPMS submittal process from PHMSA
-
- Importance of errors in annual NPMS submittals and knowing what has changed from the year before
- NPMS Top 8: How can I improve my company’s NPMS submission?
- Federal Register Notice for Information Collection Change
- New attributes that will need to be captured
- Radical increase in segmentation
- Managing Inline Inspection (ILI) data has historically been challenging in a PODS implementation and a RDBMS environment.
- Increased sensitivity of ILI sensors creates much more data that needs to be aligned to the pipeline centerline and pipeline girth welds to perform corrosion growth, anomaly analysis, and other pipeline integrity management operations and procedures.
- This model is now structured to handle the amount of data that ILI inspections generate for the life of pipe.
2. Evaluating the Suitability of the US Pipeline Network for Hydrogen service
Rosen, Houston, USA
Abstract
In response to the move towards net-zero carbon emissions, operators in the US are considering if and how existing natural gas pipelines can be converted to blended or 100% hydrogen service. Particularly given the cost of, and public opposition to, new pipelines.
This change will bring new challenges in terms of integrity management and at a minimum require a re-evaluation of the way the pipelines are operated. Building new pipelines specifically for hydrogen transportation can clearly mitigate the risk, but it may not be necessary. European operators are envisaging that ~60% of their European Hydrogen Backbone will consist of repurposed pipelines. When considering which pipelines are suitable for repurposing, the first reaction may be to dismiss the use of vintage pipelines, which are assumed to have inferior material properties compared with modern pipelines, and thus increased susceptibility to issues of embrittlement and accelerated fatigue crack growth, and hence higher risk. This may be unduly pessimistic, and we first need to consider the condition of existing lines.
A long history of pipeline inspection means that ROSEN has a significant database, which provides an indicative picture of both the material properties and condition of the US pipeline networks. In this paper some of the questions raised regarding the suitability of the pipeline network for hydrogen service in relation to existing knowledge and code guidance are explored. Specifically, we investigate the extent of existing features, such as crack-like features, dents, hard spots, and significant corrosion that could be a concern in hydrogen service under various scenarios of operating pressures and pressure cycling. In addition, we review the range of material properties and attributes present in the current natural gas transmission system, and how these compare with guidance in standards for hydrogen pipelines and developing industry knowledge.
Finally, we consider how pipeline condition and properties may influence integrity management in the presence of hydrogen. In some cases, converting these vintage lines to hydrogen may offer an opportunity to meet the existing guidelines for conversion and establish a safe operating envelope for hydrogen transportation, without the need for new-build. This paper will discuss the pro’s and con’s for the industry in terms of integrity management of converting existing pipelines to blended or 100% hydrogen service and a best practice approach for selecting candidate pipelines.
3. Your API 5L Vintage Line Pipe Fracture Toughness Data Would Likely Fall Within This Range
1Blade Energy Partners, Salt Lake City, UT, USA. 2Dow Chemical, Angleton, TX, USA. 3Dow Chemical, Freeport, TX, USA. 4Blade Energy Partners, Houston, TX, USA
Abstract
When assessing structural integrity of energy pipelines with cracks and seam weld defects, we are interested in the tolerance of the line pipe material to resist fracture in the presence of a planar defect. This material characteristic is known as fracture toughness. There are two sources of fracture toughness data commonly used in the pipeline industry: toughness measured from a starting blunt notch loaded dynamically and fracture toughness obtained from a starting sharp crack subjected to quasi-static loading. Often, neither of these two types of toughness are available for a pipeline for which an engineering planar defect assessment is to be performed. Therefore, conservative assumptions would need to be made.
A fracture toughness database comprised of nearly one hundred J-integral toughness data measured from API 5L pre-1980s ERW/EFW line pipe samples was analyzed. The fracture toughness tests were conducted in accordance with ASTM E1820 at room temperature. The analysis of these J-integral data point to ranges of seam weld bondline and pipe body toughness values that can be used in engineering assessments of pipelines with planar defects. The fracture toughness ranges are expressed in terms of Mean and Mean ± Standard Deviations. These values will support using lower bound toughness assumptions while avoiding the reliance of overly conservative toughness data. Recent J-integral toughness data from pre-1980s ERW/EFW pipe fall within these ranges. All J-integral toughness tests were conducted using a standardized sub-size test specimen and the transferability of fracture toughness results from sub-scale testing samples to full-scale pipe conditions are explored in the paper.
4. Applying API RP 1183 to Real-World In-Line Inspection Dent Data
1Highgrade Associates, Newcastle, United Kingdom. 2T.D. Williamson, Swindon, United Kingdom
Abstract
The publication of API Recommended Practice 1183 (API RP 1183) in 2020 represented a significant leap forward in standardising advanced pipeline dent assessments, and in normalising this type of assessment for pipeline operators. Beyond screening, API RP 1183 defines two main types of assessment for dent fatigue life modelling: using closed-form equations and dent shape parameters based on extensive testing and simulation (Levels 1 and 2) and detailed assessment using finite element analysis (Level 3).
This paper describes the difficulties encountered when applying the API RP 1183 guidance in the assessment of 949 dents in three separate pipelines. The points addressed in the paper include:
The method to calculate the required shape parameters from real-world in-line inspection (ILI data), which can be problematic to navigate.
- The different approaches needed for high cycled liquid pipelines versus low cycled gas pipelines.
- The need for high resolution, low noise ILI calliper data which accurately represents the pipe shape.
- The data required to carry out a Level 2 versus a Level 3 assessment.
One of the key issues with API RP 1183 is the focus on a closed-form approximation, and the general approach to the use of finite element analysis (FEA) based directly on ILI data is somewhat “discouraged” given the research factored in the code. This paper discusses an alternative, validated, approach for FEA of dents that provides a reliable and effective implementation of Level 3 fatigue assessment based directly on ILI data which removes unnecessary conservatism, provides greater accuracy and insights, and can be efficiently automated.
The paper also presents a number of real examples from the sample data and discusses the key decisions that had to be made for each dent type.
5. An Optimal Approach on Acceptance Criteria for Ripples in Pipeline Field Bends Under Internal Pressures
1BMT, Ottawa, Canada. 2Baker Hughes, Calgary, Canada. 3Exxon Mobil, Houston, USA
Abstract
In the fitness-for-service of a pipeline field bend containing ripples (or mild wrinkles), existing criteria from codes and standards (e.g., ASME B31.8 and CSA Z662) were considered (initially reported in the PRCI study PR-218-9925). These acceptance criteria define the maximum allowable ripple crest-to-trough depths (d) normalized by the pipe outside diameters (D) as a function of the hoop stress (operating stress as defined in the standards). For a gas pipeline, the maximum allowable d/D ratios are 1% and 2% at hoop stresses ≥ 47 ksi (324 MPa) and ≤ 37 ksi (255 MPa), respectively. For a liquid pipeline, the maximum allowable d/D ratios are 0.5% and 2% at hoop stresses ≥ 47 ksi (324 MPa) and ≤ 20 ksi (138 MPa), respectively.
In the fatigue life integrity assessment, the codes and standards recommend employing the PRCI stress concentration factor (SCF) equations to calculate the increase of stress levels if d/D ratios are greater than the simple and conservative limits (e.g., Fig. 10.6 of CSA Z662-2019). In total, three sets of SCF equations were developed for three loading conditions (i.e., internal pressure ~ SCFP, bending moment ~ SCFM, and temperature differential ~ SCFT).
In the recent ripple fitness-for-service assessment, it was found that the PRCI-SCF approach becomes strongly dependent on the a/C term (i.e., (a/C)^(-2.971)), where a and C are the ripple width and pipe circumference, respectively. It was observed that using a/C may lead to an unconservative SCF evaluation if the ripple is narrow (in width), e.g., at relatively lower a/C ratios (a/C<0.2). It is noted that the ripple width is generally calculated from the in-line inspection (ILI) data (e.g., normalized circumferential variations of caliper data). It may inevitably introduce a certain degree of inherent measurement inaccuracies, especially in the circumferential direction where it interacts with other features (e.g., pipe ovality).
The present study reviews the PRCI-SCF approach and corresponding applicable ranges by conducting probabilistic analyses. A revised PRCI-SCF approach was proposed to improve the prediction accuracy of stress increases for ripples or mild wrinkles in pipeline field bends under internal pressures. Two sets of data (PRCI PR-218-9925 and industrial pipe tally data) were used to generate random samples in the probabilistic study. The assessment results indicate that (1) the PRCI-SCF approach mainly considered the impact of axial profiles of ripples or mild wrinkles (i.e., depth and length/wavelength); (2) impacts of circumferential profiles, namely the feature width, were indirectly considered, and limited numbers of feature widths (a) were chosen from the feature depth-to-wall thickness (d/t); (3) the revised PRCI-SCF approach has a better prediction accuracy for evaluating SCF under the internal pressure loading (SCFp), and (4) the revised approach also has a straightforward definition with four applicable conditions and one correction factor.
6. Three Emerging Threats: Climate Change, Cyberattack and Vandalism
Dynamic Risk, Calgary, Canada
Abstract
Regulation changes have prompted pipeline operators in the US and Canada to request assistance with the assessment of threats not deemed a concern or priority in the past. The operators’ renewed interest on these threats coincides with PHMSA requests to incorporate Climate Change and Cyberattack into the existing pipeline risk models. The likelihood of failure for such threats is difficult to validate because of the lack of proper lagging and leading indicators. This work presents a tentative framework for hazard identification, data gathering, risk modeling, and integrity management of Climate Change, Cyberattack and Vandalism. Additional considerations are presented for consequence assessment and interacting threats.
7. Thought Bias: The Hidden Pipeline Integrity Threat
RSI Pipeline Solutions, LLC, New Albany, USA
Abstract
Pipeline regulations, industry standards, and technical research set forth extensive guidance for managing threats to pipeline integrity through a formal integrity management (IM) plan. Such plans rely on a rigorous procedural approach to identify threats and mitigate risk on a prioritized basis in a systematic and repeatable process. One subtle threat that is not just overlooked but is almost invisible to many integrity management personnel is that of biased thought processes. Because they typically go unrecognized for what they are such biases can seriously undermine the effectiveness of IM programs in a variety of ways that lead to poor decisions. Such biases may also affect routine pipeline construction and maintenance projects outside of IM work but which may lead to long-term IM implications. Even when information to the contrary exists prior to the decision, people can become anchored to a fallacy, unwilling to move from it. The various forms of bias, examples of their potential adverse effects on pipeline integrity, warning signs, and potential avoidance methods are discussed.
8. Pipeline Integrity Management Applications Using High Fidelity Fiber Optic Monitoring & Machine Learning
Hifi, Calgary, Canada
Abstract
Distributed fiber optic sensing has been gaining significant momentum in pipeline industry adoption. While initial deployment of this technology has focused on preventative leak detection, new value-added applications continue to emerge which deliver data that are more oriented to long term pipeline integrity management and direct operational support.
Different fiber optic sensing technologies exist which can be appropriately leveraged for various applications. High fidelity distributed sensing (HDS) achieves a very high signal-to-noise ratio (SNR), compared to other sensing or monitoring technologies. Along with high SNR, HDS also provides integrated acoustics, temperature and strain/vibration, and is optimized to do so over long distances without degradation of fidelity. This makes the HDS technology particularly appropriate for preventative pipeline leak detection as well as a number of other value-added applications which can leverage acoustics and either real time or cumulative strain/vibration measurements. These cumulative strain measurements can be extremely valuable from a pipeline integrity perspective in terms of monitoring applications such as slope stability, ground subsidence, and other points of measured strain including a variety of pigging-related activities.
A recent novel application involved collaborating with a major producer (Suncor Energy) for the successful remediation of ovality issues with a segment of the pipe constructed via boring. The HDS data assisted in the process via monitoring of multiple pig-induced strain signatures as different construction techniques were used to sequentially alleviate the pipe ovality issue associated with the vertical pipeline loading, and a caliper pig was used during each individual sequential step. Such measurements bring direct operational savings, while also assisting the pipeline operator in understanding where the dynamic / elastic segments exist along the right-of-way and detecting strain anomalies in a spatial or temporal context.
Case studies will be provided to showcase the value of using supervised / unsupervised machine learning and high-fidelity distributed sensing to enable ground disturbance / security intrusions, geotechnical monitoring of earthquakes and slope movement, pig detection / real time pig tracking, as well as analysis of multiple pig runs. A specific case study will be provided to demonstrate how the cumulative strain analysis provided by the HDS technology contributed to the identification of the geohazard risks to a specific pipeline, leading to the ultimate decommissioning and relocation of the pipe. Other “value added” applications such as flow monitoring of anomaly detection, flow rate, pressure, and density estimation will also be presented.
9. Damage Prevention 2.0 : Analysis of operational data from an automated ROW airborne visual inspection of seven pipelines: crude oil leak detection, 3rd party encroachment detection and advanced image documentation.
1Flyscan Systems Inc., Quebec, Canada. 2Enbridge Pipelines, Edmonton, Canada
Abstract
For years, pipeline operators have relied on human observers flying at low altitude to perform the mandated visual inspections of their right-of-way (ROW), often completed in single pilot-observer configuration, without any automatic documentation or detection system. This paper presents the first real-life results of a test campaign performed by Flyscan Systems over ROW’s of seven operators in seven US states and two Canadian provinces. Capabilities developed by Flyscan in collaboration with Enbridge include real-time hyperspectral leak detection and location and reporting of threats in the right-of-way. The paper will discuss the technology and system capabilities with details outlining detection of unauthorized 3rd party activity (machinery, abnormal construction activities), as well as generation of high definition 2D orthomosaics and 3D point cloud, vegetation analysis and digital surface ground mapping of the entire length of a 500-meter-wide ROW.
The paper will also review how new technologies can provide operators with a complementary tool that provides consistent, repeatable, and automated detection of high-priority threats to the integrity of pipelines. Statistics on detection performance will be presented, including unplanned threats and simulated (hidden) leaks. Real-life operational results will be covered including latency in detection, volume of data to be manipulated, cloud computing aspects as well as operational “up time” that can be expected. A development roadmap will be reviewed illustrating the path to fully automating all functions performed by human observers, including detection of ground movement, riverbank erosion, marker counting and localisation, exposure of pipelines after serious weather events, and automation of class location determination.
10. A Probabilistic Method to Predict Nominal Wall Thickness
1Pacific Gas & Electric, Oakland, USA. 2Kiefner & Associates, Inc., Sugarland, USA
Abstract
Under the PHMSA 2019 Gas Transmission Rule, Operators must opportunistically verify material properties, such as nominal wall thickness (NWT), for pipeline features lacking traceable, verifiable, and complete (TVC) records. Non-destructive examination (NDE) such as ultrasonic testing (UT) might be performed on one or more locations to measure the wall thickness. The number of measurements collected can vary by several orders of magnitude depending on the technique used, ranging from manual 12-point UT measurements to automated UT measurements which can scan the entire pipe surface generating tens of thousands of measurements. Prior to the PHMSA 2019 Gas Transmission Rule, Operators had to assess NWT following §192.109, which by design resulted in conservative outcomes. Because NWT has a first order impact on design pressure, excessive conservatism risks reducing operating capacity. This can have serious financial and operational consequences including pressure reductions and disruptions to normal operations. Operators could benefit from developing their own procedures for verifying unknown NWT using NDE under §192.607; however, they must demonstrate that the new procedures meet the special requirements for nondestructive methods and provide an equivalent or better level of safety to §192.109.
The Pacific Gas and Electric Company (PG&E) has developed a methodology, known as the Confidence Interval Method (CIM), to assess unknown NWT intended to satisfy the requirements of §192.607 by demonstrating a conservative accounting for measurement inaccuracy and uncertainty. PG&E collaborated with Kiefner and Associates, Inc. to implement CIM in a software tool. CIM uses statistics and probability theory to combine in situ wall thickness measurements, industry standards for NWT dimensions, and manufacturing tolerances encapsulated in historical editions of American Petroleum Institute Specification 5L Line Pipe. A comparison between CIM and §192.109 was performed using a validation dataset consisting of in-situ wall thickness measurements taken on pipes with TVC NWT of record. It was observed that CIM more accurately predicted the TVC NWT of record compared with §192.109. CIM addresses the uncertainty in measurement data, and when necessary, makes conservative assumptions with 95% confidence levels. The paper will also discuss how the number of measurements influences the NWT assessment by comparing results where 12-point UT and automated UT were both performed and make recommendations on the minimum number of measurements that should be collected.
11. Operator Statistical and Probabilistic Grade Estimation Using API 1176
1DNV GL, Dublin, USA. 2Otterbein University, Westerville, USA
Abstract
A key property of a pipe joint is its specified grade. For some segments, the grade is unknown due to mergers and acquisitions, lost records for legacy pipe, or other reasons. The U.S. Department of Transportation’s Pipeline and Hazardous Materials Safety Administration (PHMSA) has updated regulations leading to the need to better understand joint grade. PHMSA developed revisions to address the recommendations made by the National Transportation Safety Board (NTSB), which highlighted the importance of using accurate material properties to assess the integrity of pipelines.
GradeIt is a Power BI app that provides both a statistical and probabilistic grade estimation based on yield strength. This is not only for individual joints but with a larger look at the population of interest. The fidelity of the grade estimation relies on the number of data points, as there may be multiple yield strength measurements for each joint. GradeIt includes an adjustable degree of conservatism by allowing the user to set desired probability levels. New metrics are introduced to quantify the quality of the overall segment grade relative to the assumption of differing pipe grades.
Case studies illustrate the utility and possibilities, as well as the challenges, involved with the identification of potential segment grades. This includes sensitivity evaluation to arrive at defendable grades for pipeline segments without defined grades as well as verifying grades and populations for lines with already assigned grades.
12. Pipeline Integrity Dig Lessons Learned, Challenges, and Improvements
1Pacific Northern Gas Ltd., Smithers, Canada. 2Pacific Northern Gas Ltd., Vancouver, Canada
Abstract
Pacific Northern Gas Ltd. (PNG) owns and operates sweet dry natural gas systems with service extending from Prince Rupert on the British Columbia West Coast to the northeast of the province in the towns of Fort St. John, Dawson Creek, and Tumbler Ridge. PNG’s transmission system operates at high-pressure levels and traverses through one of the most rugged and challenging terrains in North America with unique weather and geohazard challenges. There has been an increased focus on the integrity and maintenance of PNG’s assets to ensure a safe and reliable energy supply to its customers. This has led to a considerable increase in the scale and size of PNG’s in-line inspection (ILI) program and, consequently, the integrity dig program. Modifications to its existing integrity dig program were required to ensure timely and efficient completion of the required integrity digs while meeting the technical, safety, and environmental requirements.
The structural changes include improvements in scope definition, scope communication, planning, contractor management, screening, permitting (regulatory, landowner, environmental, etc.), constructability reviews, budget estimation, construction prioritization, technical and safety requirements, execution, documentation, close-out regulatory submissions and notifications, and record keeping. Numerous challenges have been encountered that led to valuable lessons and significant improvements in all aspects of the work. Understanding that the maturity of integrity dig programs can typically take up to 3+ years, this is an ongoing process of learning lessons and their implementation of the practices for in-progress and future work.
This article will present PNG’s experience encountering common and rare challenges during the integrity dig work. Furthermore, this paper will detail lessons learned and improvements implemented into the existing processes for safety, technical, and efficiency. The intent of this paper is to share this knowledge with other operators to enhance the performance and effectiveness of their existing integrity dig processes and procedures. The ultimate outcome of this is to contribute to the continuous improvement of the industry’s best practices.
Keywords: pipeline integrity dig process, coatings, codes and standards, direct assessment, environmental studies, geohazards, geospatial systems and data, integrity management plans, IMPs, materials identification, NDE, regulations and compliance, repair and rehabilitation, SCC assessment and management, weld integrity
13. Limitations and pitfalls of non-destructive examination techniques for the validation of in-line inspections
1NDT Global, Stutensee, Germany. 2NDT Global, Houston, USA
Abstract
Field verifications are the most reliable option for the qualification of an in-line inspection (ILI) technology or the validation of an individual ILI survey. This includes inspecting the reported anomalies in situ with non-destructive examination (NDE) methods to confirm their dimensions and characteristics.
It is a common misconception to see NDE results as ‘absolute truth’. As an example, API Standard 1163:2018 recommends using a NDE method with tolerances 3 times smaller than ILI if NDE tolerances shall be ignored. Due to the continuing improvement in in-line inspections, some ILI technologies may nowadays match or even surpass NDE in terms of sizing accuracy.
The paper focuses on 2 different verification scenarios using advanced NDE technologies – inspecting external metal loss with laser scans, and inspecting crack-like anomalies in seam welds with phased array UT. Using examples from various inspection projects, the limitations and pitfalls are discussed, providing a ‘behind the scenes’ view on NDE.
The insights can help with the selection of suitable verification procedures for ILI anomalies, as well as the interpretation of verification results and their comparison with the ILI report.
KEYWORDS FOR SUBJECT AREA: field verifications, pitfalls, laser scans, phased array UT, crack, crack fields, metal loss
14. Perception vs Reality: Managing ILI Verification for Internal Corrosion
Onstream Pipeline Inspection, Calgary, Canada
Abstract
Pipelines which transport dry natural gas and refined products are generally less likely to have an active internal corrosion threat. The primary corrosion-related threat for these types of pipelines is external corrosion. Non-destructive examination (NDE) can be performed on these pipelines which provides pipeline operators with a high degree of confidence in external corrosion measurement. Although ILI-to-NDE correlation can still present challenges with external corrosion, the verification and measurement is relatively straightforward. So long as the NDE process is well documented with images and recordings such as raw laserscan data, any alignment discrepancies can be resolved offline, well after the NDE is completed.
On the other hand, ILI verification is much more challenging for pipeline systems which are susceptible to internal corrosion, or to a combination of both internal and external corrosion. In-situ NDE for internal corrosion is very difficult as the defects are not visible, making it difficult to assure NDE technicians that they are scanning precisely the right locations. Assuming that the defects are currently located, they are typically measured with techniques that are not as robust and reliable as more direct measurement techniques such as high-resolution laserscan. For pipelines with both internal and external corrosion, the different corrosion mechanisms can create very different corrosion morphologies so the verification of sizing for external corrosion is not necessarily representative of the inspection performance for internal corrosion. Due to a lack of offline data and details such as images and raw scan files, resolving alignment and sizing discrepancies after the dig is completed is very difficult.
Through a series of case studies comparing ILI, NDE and destructive testing methods, this paper will explore the unique challenges to post-ILI verification of internal corrosion defects and the significant general uncertainty to be considered when assessing ILI performance.
15. Preventing Product Releases into Coastal Waterways and Ship Channels
Quest Integrity, Stafford, USA
Abstract
Pipeline failures in today’s social, environmental, political, and global sustainability climate have a consequential impact on pipeline operators and owners. These consequences are exponentially higher when the hydrocarbon release takes place near, over or into coastal waterways, ship channels and oceans.
Even so, regulatory pressure and compliant stewardship lags the onshore transmission pipeline industry and related Integrity Management Programs (IMP’s). The financial impact and ramifications to shareholder value for spills over the past couple of decades have impacted the safety and health of neighboring communities and wildlife and ultimately cost operators billions in fines, legal costs, and the negative impacts to brand equity and sustainability goals. High consequence assets require direct measurements that cover the entire pipe surfaces to help ensure the fitness for service and flow assurance necessary to support their critical yet intermittent operation.
This presentation will highlight how a Northeastern Pipeline Company with wharf line operations is taking this threat seriously by using built-for-purpose ultrasonic inline inspection technology, seldom needing line modifications, to assess the integrity and fitness for service of their wharf line piping network. This approach enabled the company to optimize capacity by safely maximizing throughput while also minimizing risk to environment and business continuity.
The Operator had multiple pipelines spanning several diameters servicing a wharf used to transfer fuel from the dock to the tank farm. The goal for this project was to gain confidence in the continued safe and reliable operation of these pipelines by having 100% of the piping inspected to ensure all potential integrity threats were known, and if needed, appropriate action could be taken to mitigate any significant risks identified in the assessment. To accomplish this, the Operator utilized ultrasonic inline inspection technology to inspect the lines for both wall loss and deformation in a single pass.
Additional reasons to those above for selecting this technology included the need for a bi-directional tool capable of negotiating tight bends that posed the least risk for getting lodged during operations, while collecting direct, accurate measurements of anomalies across the entire pipeline. The end result was a successful execution on the first mobilization, preliminary and final reporting were delivered in an expeditious manner to help ensure safe continued operations.
By nature, inspection of dock side pipelines requires different planning and support than onshore pipelines. This paper will elaborate on such a process and how the efficiency and ease of a well-planned project can impact future operations by reducing risk, ensuring the safe and reliable service of critical energy infrastructure.
16. OPEX Optimization for Unpiggable Vent Line/Low Flow Pipeline via Self-Propelling Robotic ILI Tool
¹PETRONAS, Kuala Lumpur, Malaysia
Abstract
OBJECTIVE/SCOPE
This paper is to share the development of Self-Propelling Robotic In-Line Inspection technology that PETRONAS embark as OPEX optimization for un-piggable pipeline. Lack of conventional inspection methods to inspect un-piggable pipelines such as vent pipelines without pig traps facility and low flow pipelines, has prompted PETRONAS to embark on technology development journey for Self-Propelling Robotic ILI.
METHODS/PROCEDURES
The development of the Self-Propelling Robotic In-Line technology consists enhancement of robotic tethered crawler tool to a wireless robotic tool, testing and validation using actual full scale fabrication test loop. Fabricated test loop includes horizontal and vertical section with bends of 1.5D to simulate the inspection tool travel as per actual site condition representing vent line.
The enhancement consists of wireless connection range, optimum speed and distance, movement of slippery surface which grease was applied on the vertical section and emergency extraction of inspection robot.
RESULTS/OBERVATIONS/CONCLUSIONS
Robotic ILI qualification test which was successfully met PETRONAS requirement based on full scale factory acceptance test. The test was focused and able to meet below success criteria: –
1. Robotic ILI tool able to self-propel on vertical test spool.
2. Robotic ILI tool able to move with wireless connection for the intended travel length.
3. Emergency retrieval tool procedure and mechanism in the event of faulty robotic ILI or loss of connection.
4. Sensor detection capability at POD 90% and POI 80%.
Based on the evaluated technology, Robotic ILI solution is feasible in ascertaining the un-piggable pipeline integrity and recommended solution to tackle high operational costs that upstream operators face when inspecting their pipelines using current available methods. Deployment of this technology is estimated to provide up to 30% OPEX optimization.
The technology has been evaluated to be technically ready and pilot tested PETRONAS asset which will be shared in our detail paper covering below areas:
1. Robotic ILI tool able to travel successfully total length of pipeline.
2. Detection capability at POD 90% and POI 80% for anomalies covering metal loss and girth weld anomales.
NOVEL/ADDITIVE INFORMATION
Current approach to inspect un-piggable vent or low flow pipeline is Crawler ILI type technology which propelled by umbilical cable whereby the pipeline requires to be in shutdown mode. While, inspection using Self-Propelling Robotic ILI can be applied for un-piggable pipeline i.e. low flow pipeline and vent line with short duration or no requirement of shutdown.
17. 192 Final Rule (RIN2) – Essential Elements and Guidelines to Perform a Dent Engineering Critical Assessment
1DNV, DUBLIN, USA. 2DNV, Dublin, USA. 3TC Energy, Calgary, Canada
Abstract
The Pipeline and Hazardous Materials Safety Administration (PHMSA) issued RIN2 of the Final Rule (frequently referred to as the “Mega Rule”) on August 4, 2022, which will impact the pipeline industry’s approach for the assessment of dents and other mechanical damages. The Mega Rule prescribes detailed requirements in the Code of Federal Regulations (CFR) Title 49 Part §192.712(c) for how to perform a dent engineering critical assessment (ECA).
This paper is purposing to share the understanding of the requirements from the Mega Rule when performing a dent ECA by a detailed example. The example includes the identification of other potential threats in the vicinity of a dent, dent profile comparison, dent strain assessment using the Ductile Failure Damage Indicator (DFDI) and Strain Limit Damage (SLD) methodologies, and dent fatigue assessment.
To fathom the new Mega Rule for gas operators and achieve the best compliance, guidance regarding best practices in performing a dent ECA will be provided hereby through a detailed work example. Limitations of utilizing the methodologies prescribed in Part §192.712 (c) will be discussed in conjunction with the guidance for awareness.
18. Detaining Dents – Determining Restraint for Dents Measured by ILI Case Study
1T.D. Williamson, Salt Lake City, USA. 2Phillips 66, Houston, USA
Abstract
The assessment of dented pipelines received a key advancement in standardized approaches with the first publication of API Recommended Practice 1183 – Assessment and Management of Pipeline Dents. One important factor in estimating the fatigue life of a dented pipeline, as described in API RP 1183, is determining the restraint condition of the dents. API RP 1183 describes a process for determining a dent’s restraint condition according to the results from the PRCI MD-4-9 research project. This main method for determining dent restraint calculates a restraint parameter based on characteristic lengths and areas of the dent shape. It improves upon the traditional techniques of using a dent’s orientation to determine restraint or conservatively assuming all dents to be unrestrained. Difficulties can be encountered, however, in applying it practically to dents measured by ILI. For example, identifying pipe geometry baseline shape and proper smoothing of raw deformation data.
This paper describes the API RP 1183 restraint parameter, the challenges encountered when applying it to dents measured by ILI, and helpful tips for improving restraint determination results. A case study is presented involving determining the restraint condition of 231 dents with shallow depths, many of which initial restraint parameter calculations disagreed with experience-based restraint determination. Recommendations for handling these cases and for potential future work and improvements are made.
19. Investigating the Impact of Changes to Formation Strain Predictions on Dent Integrity Management of Gas Pipelines
1ROSEN USA, Houston, USA. 2PG&E, San Ramon, USA
Abstract
Pipeline Research Council International (PRCI) has recently completed a study funded in part by the Department of Transportation (DOT) and the Pipeline Hazardous Materials Safety Administration (PHMSA) to improve dent/cracking assessment methods for mechanical damage assessment.
Results from the DOT PHMSA project 855 have suggested that the current equations found within Appendix R of ASME B31.8 used to predict dent strain may under-estimate the formation strains, especially for deep and narrow dents or for unconstrained dents. Formation strain is an important characteristic of dents, with critical values potentially inducing the formation of cracks. US DOT regulation 49 CFR 192 requires injurious dents to be remediated while noting that dents where critical strain values are not exceeded may remain in operation as a monitored condition. Accurate prediction of the formation strain for any dent is important in ensuring the structural integrity of the pipeline.
Findings from the DOT PHMSA research program have proposed a modification to the ASME equations in order to better estimate the strain incurred during formation. The new methodology modifies the ASME equations through the adjustment of the axial membrane strain component as well as the incorporation of an additional circumferential membrane strain component. Furthermore, an additional correction for unrestrained dents has been proposed.
Understanding that industry standards and regulations are driven by research performed by PRCI and others, it is essential to understand the impact that these changes to formation strain predictions may have on dent integrity management of US operated gas pipelines. This study investigates the acceptability of dents by comparing strain values, calculated from the current ASME equations, against the methodology proposed in DOT PHMSA project 855. In-service dents for a wide range of pipe geometry and dent shapes from several gas pipelines have been utilized for this study. The current work details the comparison and findings for restrained and unrestrained dents assessed using the dent profiles captured during ILI tool runs. Furthermore, the strain assessment results are compared against critical strain limits to illustrate the impact the proposed methodology will have on gas pipeline systems operating currently. Finally, a discussion as to how these results may be incorporated into the Integrity Management plans of gas pipeline operators is presented.
20. Navigating the New §192.712 Regulation on Dents
1D2 Integrity, LLC, Houston, USA, D2 Integrity, LLC, Houston, USA, 2DCP Midstream, Houston, USA
Abstract
API RP 1183 was released in 2021 and was expected to be a precursor for updated regulations addressing dent assessments. In the fall of 2022, the Pipeline and Hazardous Materials Safety Administration (PHMSA) released the final part of the updated gas rule. In this part of the rule, §192.712(c) specifically addressed the assessment of dents and other mechanical damage. This paper examines the new section of code and provides technical guidance on how these dent regulations can be understood and applied in integrity management programs. In addition, this paper will examine where API RP 1183 and the updated gas rule are not aligned.
21. Full-Scale Fatigue Testing and Assessment of Dents on Brittle Longitudinal Welds – A Detailed Management Approach for a Liquid Pipeline in Chile
1ROSEN Group, Newcastle upon Tyne, United Kingdom. 2SONACOL, Santiago, Chile
Abstract
SONACOL owns and operates a 135 km, 6-inch diameter pipeline refined products pipeline located in Chile, which was constructed in 1964 from longitudinally welded (ERW) pipe with thicknesses between 5.16 and 12.7 mm. This pipeline has been inspected on multiple occasions for metal loss, deformations and cracks as part of its Integrity Management Plan. Following the most recent inspection and subsequent integrity assessment, an operational pressure reduction was introduced as some of the reported dents were considered to pose an immediate threat to the pipeline integrity. Of particular concern were dents identified to be associated with brittle longitudinal seam welds.
SONACOL supported by ROSEN have developed a strategy to assure the continuous safe operation of this pipeline. This involved a full scale testing and various levels of assessment increasing in complexity.
The strategy included the selection of critical dents, which were removed from the pipeline and underwent a full-scale fatigue testing, NDT assessment and material characterisation tests. Testing results demonstrated an acceptable level of conservatism in the assessment methods since fatigue growth was found to be overestimated. Dents were prioritised using an initial EPRG fatigue assessment followed by an FEA assessment. Additionally, the API 1183 longitudinal weld interaction was used to determine the likely effect of welds on the fatigue life of dents. The integrity assessment, which incorporated all ILI reported features including crack like anomalies, was used to develop a refined repair plan. This strategy has allowed Sonacol to continue operating the pipeline and demonstrate a suitable safety margin for that.
This paper summarises the different stages through the process of developing the dent management strategy.
22. ILI Tool Speed Control Using Gas Recompression –– Better Data / No Venting or Flaring
WeldFit Corporation, Houston, USA
Abstract
The purpose of in-line inspection (ILI) is to provide reliable information about pipeline integrity so operators can prioritize maintenance and repair. Typically, ILI tools are propelled through pipelines mechanically. Either they flow at the same rate as product or are moved by differential pressure, which occurs when the operator releases downstream pressure through flaring or venting.
However, both methods are limited in their ability to reliably control the speed of the ILI tool as it travels through the pipeline. Lack of speed control, that is, failing to keep the inspection tool moving at a reduced and constant speed, makes it more difficult for the tool’s sensitive sensors to pick up critical anomalies, affecting data quality. If the tool moves too quickly, it can miss defects or damage, producing inaccurate or incomplete readings. When the tool travels too slowly, it can exaggerate findings, creating a false impression of the pipeline’s wall condition. In addition, varied tool speeds make it more difficult for data analyzers to piece together information about the pipeline.
Unreliable ILI data can lead to expensive and time-consuming tool reruns or unnecessary digs. To improve data results, many ILI tool manufacturers incorporate speed control into their devices. However, this limits the vendor options for operators.
After lack of speed control during five consecutive ILI tool runs led to insufficient data each time, the nation’s largest interstate natural gas operator turned to a novel, engineered solution to controls gas flow and ILI tool speed: recompression technology.
Recompression technology is typically used to reduce methane emissions during pipeline isolation. In this case, equipment with straight-line capabilities, meaning it moves gas at a constant rate, created a constant pressure differential across the ILI tool. That enabled the tool to travel at consistent speed throughout the pipeline.
Using recompression technology, the operator collected accurate data in a single run. They also avoided flaring product, helping them achieve their environmental, social, and governance (ESG) goals.
This white paper will discuss problems related to ILI tool speed control and describe how recompression technology was used to improve ILI data collection while also eliminating nearly 100% of methane emissions.
23. Innovative Pipeline Evacuation Technology for Reducing Methane Releases to the Environment During Pipeline Maintenance and Pigging Operations
Onboard Dynamics, Bend, USA
Abstract
Pipeline operators are showing a growing interest in adapting new technology solutions and operating practices to reduce methane releases during pipeline operations and maintenance. This increasing attention is focused on methane capture and recovery during routine pigging operations. The number of pigging operations, and the fact that they are usually conducted on a predictable schedule, suggests that this source of methane release should be a prime target for operators seeking to improve their environmental profile.
This paper will provide an overview of technologies and operating practices that can be implemented to reduce methane releases during pigging, highlighting technology features that are most important in determining project success. The important product features that will be discussed include gas capture time, system set up time, and consideration of equipment physical size and how these factors all impact gas capture time and cost.
We have developed and will present a calculator that can be used to estimate the reduction in methane released for every launch and receive operation based on pipeline size and pressure.
24. Keeping Pigging Safely Grounded as Hydrogen Takes-Off
T.D. Williamson, Newcastle, UK
Abstract
- As hydrogen takes off in terms of an alternative fuel, there are so many things to assess including how pure or blended pipelines will be pigged. This presentation will highlight the elevated risk profile that hydrogen poses during the pigging, what operationally pipeline owners need to consider in terms of running tools and the importance of design, procedures and people.
- Attempting to align cluster boxes instead of individual metal loss boxes.
- Assuming moderately deep anomalies in the current inspection that were not successfully matched to the prior inspection initiated at zero depth in the prior inspection.
- A comparison of the form versions and general observations on the now consistent format and units as well as the incremental data collected.
- Geographical representation of incident history for 2010-2021, with volume and failed asset representation in point size scale and color notation.
- Asset specific evaluation data for major categories including: Vessel, Compressor, Valve, and Pipe.
- Each asset category analysis includes unique design trends related to: commodity carried, cause, year of manufacture, failed component, nominal size, seam type, external pipe coating type, and current function.
- Each asset category analysis includes unique operational trends related to: natural force contributors, incorrect operation factors, equipment activity, year of install, availability and use of procedures, incident identifiers, corrosion type, current corrosion efforts, current integrity programs, and ILI history.
- Incident release volumes and cost details for each asset were reviewed for financial impact on operators.
- Operator Annual report data was utilized to identify any disproportionate conditions related to: seam type, manufacture year, etc.
- Incident costs were evaluated with comparison to consolidated operator Annual Report data for predictive incident volume and cost per mile evaluations.
- Key observations and recommendations were summarized for each asset category with supporting industry standards and recommended practices references.
- UT ILI capabilities on detecting (POD), identifying (POI), and sizing (POS) selective seam corrosion (SSC) for compression wave and shear wave
- Analysis methodology to address these features
- Integrity recommendation on the technologies to be used for these features
- Zoning of geographic areas with the greatest likelihood of theft.
- Implementation of maintenance actions for timely repairs.
- Prioritized actions in areas with susceptibility to the threat of theft.
- Correlation to PDCA
- Regulatory compliance with both CAD and US Regulations
- Flowchart/cheat sheet for US/CAD ECA vs. EA comparison chart
- ECA can be used for MAOP validation
- EA used primarily as “get out of jail free” card.
- FFS/RTS Eas cover all applicable threats. But EAs in general can be only about one threat or multiple.
- Case study for sample EA (anonymized)
- Theme: identify strengths in both EA and ECA methodologies and present an approach where their combined strengths are used to assess integrity of a pipeline asset.
- A testing methodology that can measure the time dependent creep behavior of vintage LF ERW bondline flaws from actual small-scale test samples, at elevated stress levels as well as stress reversals (creep and pressure reversals). The testing would be analogous to pressure testing.
- A series of tests used to measure the growth of actual bondline flaws of vintage LF ERW seams at elevated stress levels.
- Implications on managing pressure reversals in hydrostatic tests.
- Should the next reassessment be a hydrotest or a crack-detection ILI?
- If a hydrotest is executed, what is the optimal test pressure that will maximize the reassessment interval while minimizing the chances of a test failure?
- If a crack-detection ILI is executed, how many repairs would be expected following the inspection? How will the ILI performance play a role in determining this?
- Magnetic strength
- Magnetic saturation
- Residual magnetism
- Pipe Wall Thickness
- Velocity
- Sampling Rates
- Debris
- Compressive and/or Tensile Residual Stress
- The sleeve type (Type A or Type B).
- Sleeve characteristics (Stacked/Segmented).
- The anomaly type(s) observed under the sleeve.
- The deepest reported metal loss depth (%) under the sleeve.
- The presence of additional metal loss under the sleeve (unreported or reported).
- If metal loss under the sleeve has preferential-to-the-sleeve characteristics.
- Given the right conditions, Type A sleeves may not inhibit external metal loss growth under the sleeve.
- The importance of utilizing multiple ILI inspections and ILI technologies to identify integrity threats.
- The methodology and decision tree to determine potential areas of preferential metal loss under sleeves.
25. Using Controlled Acoustics to Find a Stuck Pig
Seismos, Austin, USA
Abstract
SCOPE:
A pipeline operator was preparing to run an in-line inspection on a 4’’ NGL Line in South Texas. Prior to the inspection, the operator launched a 31’’ Mandrel Pig with a Gauge Plate and Cleaning Tool. The mandrel pig was unable to flow the total distance and got caught somewhere in the middle of the pipeline. An unsuccessful second and third pig was launched two weeks later to try and dislodge the first gauge plate pig. Several methods were used to locate the pigs, including geophones, transmitter detection receivers, and mainline block valve pressure differentials.
PROCESS:
To find the missing pig, Seismos used an Acoustic Transmitter, Acoustic Sensor, and Data Acquisition Unit (DAQ) to create controlled acoustics within the pipeline. The equipment was attached to the pipeline at above-ground stations through standard Male Pipe Thread (MPT) connections.
The acoustic transmitter emits a pressure pulse that causes a tube wave to travel via the pipeline media down the length of the pipe. The acoustic energy reflects off the object and the return signal is captured by the acoustic sensor. Signal processing software is used to analyze the return signal providing the object’s precise location.
RESULTS:
Seismos informed the operator of the location of the lost pigs, which ended up being 2+ miles away from where the operator initially thought going into the project. The operator decided to start excavating based on Seismos’ analysis. The pigs were found precisely where Seismos’ analysis had indicated.
********
26. The Mega Rule brings greater challenges to “Pigging the Unpiggable” that will require new chemical pigging technologies.
1PIC Chemicals, Tomball, USA. 2Sanccus Limited, Aberdeen, United Kingdom
Abstract
Many of the 425,000 miles of gathering system pipelines now being regulated under the Mega Rule are a byproduct of the growth of the natural gas production from unconventional shales. New gas pipelines were constructed without envisioning the challenges of meeting rigorous standards. Minimizing leak risks caused by internal corrosion is one of the foundational pillars of the regulation. Pipelines with corrosion risks must show increased monitoring, sampling and pig cleaning. Gathering pipelines, by their very nature, often have mechanical barriers to traditional mechanical pigging. Solutions for mechanical impediments such as variable diameters, tie end connectivity, hard 90 degree turns, tees and tee bars and many other obstacles are provided. Chemical gels fit into 3 categories that include liquid gels (targeted cleaning), gel pigs (liquid/liquid pigging), and solid gel pigs (gas propelled). Linear Chemical gels can pick up debris and safely dissolve contaminants such as iron sulfide and magnetite as well as work as a surveillance pig to locate blockage like wax and scale. Hygroscopic drying gel pigs are invaluable as part of hydrotesting operations. Liquid gel pigs are rigid crosslinked gels that automatically adjust to varying diameters and mechanical barriers to serve as a spacer, barrier or swab pig. New solid gel pigs called Shape Memory Pigs (SMP) can adjust up to 50% diameter changes over great distances. When encountering excessive barriers or blockage the SMP will break up into small flowable pieces avoiding sticking risks. It can be launched with its own canister or formed in situ by pumping through a needle valve as liquid into a compressible, full bore solid pig. SMP can be propelled with liquids, gas or multiphase flow. Any barrier that prevents utilizing mechanicals pigs can be accommodated by these new novel technologies. This paper provides design guidelines for selecting and customizing solutions using these chemical pigging technologies..
27. Minimizing the Error in Corrosion Growth Rate Estimation from Box-to-Signal Matching
T.D. Williamson, Salt Lake City, USA
Abstract
The benefits of conducting signal-to-signal matching between two successive in-line inspection (ILI) runs for purposes of estimating corrosion growth rates have been discussed at length in the pipeline industry. However, in many situations, the complete signal data for both inspections are not available to the analyst. Perhaps only the raw signal data for the current inspection is available and only a reporting spreadsheet is provided for the prior inspection. In this case, a box-to-signal matching exercise is required. How should this exercise be conducted such that it minimizes the error in the estimated corrosion growth rate?
There are multiple ways that error can creep into a corrosion growth rate analysis, especially when full signal data is not available for both inspections. Some of the largest sources of error are related to anomaly alignment rather than to depth measurement uncertainty. These include:
These types of errors introduce substantial scatter into the distributions of change-in-depth between inspections and can result in significant errors in growth rate estimates. This paper presents practical strategies that operators and service providers can adopt to avoid these large error sources.
28. Lessons Learned from Applying Probability of Exceedance (POE) Analyses
DNV USA, Dublin, USA
Abstract
The Probability of Exceedance (POE) methodology was introduced in the late 1990s to manage corrosion on pipelines after in-line inspections (ILIs). It helps prioritize anomaly locations for remediation by calculating their likelihoods of exceeding one or more thresholds that correspond to potential leaks and ruptures. By applying POE, a pipeline operator can assess how the likelihood of a release changes with time, which can be used to design rational and science-based remediation programs.
DNV has developed and used an improved POE methodology to analyze a range of pipelines and develop remediation strategies. The methodology explicitly considers growth in both the depth and length directions. In conducting these analyses, a number of learnings were developed. Understanding how longer anomalies (e.g., clusters of individual anomalies) grow to failure is critical. This paper will discuss how different growth methodologies can affect coalescence of individual pits in clusters and the severity and likelihood of failures due to rupture.
29. Beyond Standard ILI Analysis – Meaningful Interaction to Look Out for Specific Threat
1Baker Hughes, Stutensee, Germany. 2Enbridge, Edmonton, Canada
Abstract
Within the framework of the requirements defined by API 1163, close cooperation between the operator and ILI service provider is required to manage pipeline integrity. Nevertheless, many factors could contribute towards the lack of cooperation – discussion of requirements and challenges, lessons learnt, and sharing of NDE results. There is growing evidence of a willingness to share NDE results; however, this paradigm shift is not just because operators understand that the vendor always has full visibility of ILI data to support performance validation. Rather, there is also the realization that improvement processes can be stimulated in general. Furthermore, through meaningful interaction, a holistic inspection project can be achieved on a pipeline-specific basis. A case study will show how a specific pipeline threat was addressed by considering historical records beyond the standard analysis of an inspection project by utilizing additional ILI data sets (integrated analysis). This would not have been possible without close cooperation from the start of the inspection project.
30. In-Depth Review of DOT 192 & 195 Pipeline Incidents and Accidents for 2010-2021
IC Solutions, Edmond, USA
Abstract
For the past two years I have presented at the GPA-Midstream conferences on individual analysis of the natural gas transmission and hazardous liquids pipeline PHMSA incident and accident history. Over the last decade, natural gas pipeline operators experienced $1.4B in damages from 1,364 events. Each of these events had the potential to collect 622 unique data entries related to the incident. For the hazardous liquids pipelines, the overall costs nearly double at $2.7B in damages on nearly 4,000 events, with a similar count of unique data points required in accident reporting. The presentation included analysis, trends, and opportunities for improvement. The initial exercise was initiated after realizing the PHMSA accident reporting form, RSPA F 7000-1, had undergone a significant revision in 2010 and was now collecting more than twice the data of the previous version form. The same improvements were relevant for PHMSA F 7100.2 I now plan to conduct a comparison of natural gas and hazardous liquid pipeline data sets along with European pipeline accident history and highlight areas of potential improvement in pipeline safety.
My evaluation and analysis consists of the following:
I believe this data set and associated presentation provides a useful industry review for the last decade of pipeline incidents and accidents. Operator representatives for engineering, operations, construction, and HES organizations can benefit from the industry lessons learned, potential risks, and opportunities for improvement.
Keywords: DOT 192 & 195 – Compliance, Operations & Maintenance, Pipeline Safety, and Safety & Reliability
31. The Future of In-Line Inspection (ILI): New U.S. Gas-Gathering Pipeline Regulations and ILI – What to Do, and Not to Do, to Comply with the Law, an Operator’s Perspective
G2 Integrated Solutions, now Entrust Solutions Group, Houston, USA
Abstract
Traditionally, most gas gathering lines were small diameter low-pressure systems traversing sparsely populated areas, posing little risk from a business, safety, and environmental concern. More recently, the volume of gas transported through gathering systems has increased significantly due to the advancements in horizontal drilling and hydraulic fracturing techniques. Subsequently, gas gathering systems have evolved into larger-diameter pipelines operating at much higher pressures in formerly rural areas. As a result, the Pipeline and Hazardous Materials Safety Administration (PHMSA) issued a final rule that expands Federal pipeline safety oversight to all onshore gas-gathering pipelines. This new rule changes the definition of a regulated gas-gathering pipeline. More than 400,000 additional miles will be covered by Federal reporting requirements. This paper describes how a competent and proactive operator implemented a program to comply with the new regulations and prepared thousands of gathering pipelines for inspection with ILI tools. The lessons learned will be illustrated with a case study.
32. Survey of Impact: RIN-2 Final Rule – Safety of Gas Transmission Pipelines
1Integrity Solutions Ltd, Bossier City, USA. 2Integrity Solutions Ltd, Missoula, USA. 3Integrity Solutions Ltd, Denver, USA
Abstract
New federal regulations contained in RIN 2137–AF39 titled “Safety of Gas Transmission Pipelines: Repair Criteria, Integrity Management Improvements, Cathodic Protection, Management of Change, and Other Related Amendments” impose new requirements on natural gas transmission pipeline operators. This presentation will provide an initial survey of impact of the Final Rule on operators affected by the final piece of a decade-long effort by PHMSA to amend its regulations of onshore gas pipelines, known as the “Gas Mega-Rule”.
This new rulemaking considers lessons learned from recent onshore gas transmission pipeline incidents and codifies a management of change process. The rulemaking also clarifies certain integrity management, assessment, corrosion control, repair, high consequence area (HCA), and extreme weather event requirements, as well as revises or creates new definitions related to the above amendments.
Compliance requirements, key dates, and a sample case study on the ramifications to corrosion control and integrity management repair criteria will be provided. Integrity Solutions® Ltd will not be producing a white paper to support the presentation, however, an advanced preview of the presentation can be provided.
33. Applying Ultra-High-Resolution MFL To Achieve a Better Integrity Assessment of Pits-in-Pits.
Entegra, Toronto, Canada
Abstract
The VP of Asset Integrity for a major US west coast liquids operator once asked us to guess the number one cause of leaks on their pipeline systems over the previous year. The answer? 20% deep metal loss … in other words, deep (through wall) pinholes were embedded in an area of less than 20% deep corrosion, also known as “pits-in-pits”. With the advent of Ultra-High Resolution (UHR) Magnetic Flux Leakage (MFL) In-Line Inspection (ILI) techniques, the nuances of complex corrosion can now be reliably explored … including pits-in-pits.
This paper will describe how an increased sensor density and sampling frequency in combination with human-experience based decision making in the analysis process can be deployed to accurately detect, characterize, and size potentially injurious complex corrosion. Data comparisons with in-the-ditch results will be presented.
34. Assessing the accurate topography of complex channeling corrosion by means of ultrasonic wall measurement tools. A case study and experiences
1NDT Global, Houston, USA. 2NDT Global, Stutensee, Germany. 3NDT Global, Stutensee, USA
Abstract
This paper presents a case study of an offshore pipeline with pitting and long axial corrosion that had been continuously inspected by Magnetic Flux Leakage (MFL) and was recently inspected with an Ultrasonic Wall Thickness Measurement (UTWM) tool. An anonymized comparison of 3 MFL inspections and the recent UTWM inspection is presented. This analysis demonstrates the challenges associated with the two methods, and how UTWM can be used to acquire topography that describes the complete extent of metal loss. Further, the case study also shows a new and more customized approach to providing data that enables a better comparison of results between different ILI methods. Finally, direct measurement data enables advanced integrity methods, like DNV-RP-F101 Appendix D, which uses wall thickness and standoff data to calculate pipeline capacity and system effect considering the effects of long axial corrosion continuously spanning multiple pipe joints.
KEYWORDS FOR SUBJECT AREA: ultrasonic tools, metal loss corrosion, correlation, complex channeling corrosion, DNV-RP-F101 Appendix D
35. Optimizing Risk Decisions with Imperfect Data
RSI Pipeline Solutions, Oklahoma City, USA
Abstract
In any integrity management program, there are always competing alternatives for any decision. Such as dig or not to dig, replace or not to replace. If perfect information were always available, like a math problem where everything except the answer is given, risk engineers would be an unnecessary expense. The next best alternative would be an exhaustive corpus of data with frequencies of every outcome and condition combination. However, in all but the most trivial cases, these don’t exist either and the engineer is dealt partial, imperfect information where the true state of nature is uncertain. To deal with this uncertainty in everyday life people develop heuristics, mental shortcuts that allow us to process this information with the least amount of effort and time. But when the probabilities are imprecise and the data imperfect, decisions based on these shortcuts can be fraught with biases and fallacies. All decisions carry some risk that is dependent on the (uncertain) true state of nature, and the potential loss associated with a given course of action.
This paper will discuss the fundamentals of decision theory and demonstrate an innovative application of them that incorporates existing knowledge and potential consequences. This will be used to quantify the tradeoffs of competing alternatives in an pipeline integrity management program to arrive at a decision that minimizes the risk based on the state of knowledge that is available.
36. Estimating Excavation Damage (Outside Force) ‘Hit Rates’ Using Machine Learning Models Trained on In-Line Inspection Data and Geographical Information
ROSEN Group, Newcastle upon Tyne, United Kingdom
Abstract
External interference damage is one of the main causes of pipeline failure reported in publicly available industry statistics, from agencies such as the United States Pipeline and Hazardous Materials Safety Administration (PHMSA). Thus, failures due to external interference are often the most significant contributors to pipeline probability of failure in risk assessments and can play a significant role in operator decisions regarding risk-control measures, for example when it comes to the installation of additional impact protection, pipeline diversion or pressure restrictions.
The probability of failure due to external interference damage can be estimated by combining the probability that damage occurs (i.e. that the pipeline is hit), the probability that the impact is sufficient to cause instant failure and the probability of degradation to failure, given that damage has occurred. Degradation to failure is assessed using industry standard engineering models (such as the limit state functions given in Annex O of CSA Z662-19). However, the key challenge is predicting where, when, and with what energy the external interference damage may happen.
The prediction of a “hit-rate,” or impact frequency, is often subjective or based on statistics which may not be applicable to the pipeline under assessment. Top-of-line (ToL) deformation damage (dents) reported by in-line inspection (ILI) are a clear indicator of past external interference, which could have been caused by third parties, contractors or the operator themselves. In a recent in-house research study ILI data and pipeline parameters from ROSEN’s Integrity Data Warehouse (IDW) – which at the time of writing contains results from over 20,000 inspections – has been combined with geographical information on population density, land use, crossings and socioeconomics, and used to train machine learning models to estimate the frequency of external interference damage (per mile-year), or ‘hit-rate’ for pipelines where the route is known but reliable statistics for ‘hit-rate’ are not available.
This paper presents the results of the study describing the extensive dataset used from a selection of pipelines in the USA, the development of the models and how they were trained and tested, and finally showing the model performance, discussing the capabilities and limitations, and implications for risk assessment studies.
37. Gas Transmission Valve Closure and Emergency Response Considerations
L&A Inc, Calgary, Canada
Abstract
This paper provides a summary of transient flow predictions from an ignited gas rupture site when closing both valves in a valve section at increasing timing intervals. The closure response time from detection of a line break to valve closure has less effect on emergency responder search and rescue initiation inside the PIR than the public may expect. The effect of various mitigations to shorten the interval will be discussed.
38. Variability and Mitigative Measures for Estimating Yield Strength in Line Pipe by Instrumented Indentation Testing
1RSI, New Albany, USA. 2Exponent, Houston, USA. 3Pacific gas and Electric, Walnut Creek, USA
Abstract
Natural gas pipeline operators in the United States are increasingly implementing materials verification programs (MVP) to validate the properties of pipelines that lack reliable records. These programs rely on nondestructive testing (NDT) methods, such as Instrumented Indentation Testing (IIT), to estimate the mechanical properties of pipeline steels in situ. The NDT approach is attractive because it does not require material to be cut from the pipe, as does traditional mechanical/tensile testing. However, IIT and other NDT methods infer the bulk mechanical properties from a relatively thin surface layer, and extrapolation to through-wall properties can introduce errors due to factors including material inhomogeneity and residual stresses from manufacturing. This work will consider the variability in the IIT yield strength from seven line pipes tested in multiple locations by two different vendors. It will be shown that while the measured IIT yield strength is often within ±10% of the tensile test result, some results can exceed this range. Furthermore, it will be shown that the yield strength estimated by IIT can vary by as much as 20% based on both the axial and circumferential location on the pipe. Sources of this variation, including the effects of sampling depth, will be discussed with consideration of residual stress, decarburization, and alloying variability. Recommendations will be made for best practices to identify and mitigate measurement uncertainty related to these effects.
39. Identifying Irregular and Erroneous Chemical Composition Data from In Situ Nondestructive Testing
1Exponent, Inc., Menlo Park, CA, USA. 2RSI Pipeline Solutions LLC, New Albany, OH, USA. 3Pacific Gas and Electric Company, San Ramon, CA, USA. 4Exponent, Inc., Houston, TX, USA
Abstract
Nondestructive testing (NDT) of chemical composition is a critical component of the Pacific Gas and Electric Company’s (PG&E) materials verification program. Additionally, 49 CFR § 192.607 states that the operator must “conservatively account for measurement inaccuracy and uncertainty using reliable engineering tests and analyses.” Accurate and precise NDT composition data can be used to determine or verify certain characteristics of a pipe, for example vintage, grade, or manufacturing process. However, it has been observed that composition measurements may at times be inconsistent across various field analytical tools, possibly due to the variability of experimental, environmental, and other statistical (random) factors. Irregular or erroneous field NDT measurements are problematic because they could lead to the mischaracterization of pipe features during the materials verification process.
In this paper, we present a systematic procedure rooted in data science for the analysis of field NDT chemical composition data. First, NDT composition data for a set of pipe features are collected using field analytical techniques, such as optical emission spectroscopy (OES), laser induced breakdown spectroscopy (LIBS), X-ray fluorescence (XRF), and laboratory analysis of filings by atomic absorption (AA) and combustion. Next, the data are statistically analyzed using only the measurements in the incoming dataset and, when possible, are compared to measurements obtained for the same pipe features using other NDT composition analysis techniques. Following this analysis, the data are compared to historical composition data previously obtained for features with similar attributes—such as outer diameter (OD), seam type, and nominal wall thickness (NWT)—to identify potentially erroneous measurements. Finally, we present case studies illustrating the application of the proposed process to data obtained for pipe features at PG&E with abnormally high manganese measurements, and we demonstrate how the identification of the elevated manganese values as anomalous mitigated potential downstream challenges during the materials verification process.
40. Combining Nondestructive Techniques to Obtain Full Vintage Pipeline Asset Fracture Toughness at Both the Seam and Pipe Body
MMT, Natick, USA
Abstract
For vintage transmission pipeline assets, material toughness data is often limited to laboratory testing of opportunistic pipe cutouts because, even if original Material Test Records (MTR) are available, the manufacturing specifications for the line pipe did not have fracture toughness requirements until they were added in the 1980s. Given the need to obtain Traceable, Verifiable, and Complete (TVC) material data in certain assessments and re-confirmation, nondestructive evaluations (NDE) are an attractive alternative to pipe cutouts if these solutions can be validated and accepted. Past attempts to validate indentation and frictional sliding techniques for the pipe body toughness have proved challenging. This paper summarizes recent progress in developing and validating two recent techniques based on frictional sliding. The first technique uses the Hardness, Strength, and Ductility (HSD) testing process which operates on the principle of frictional sliding over longitudinally welded seams, allowing, by a combination of surface field test and a database, to produce predictions for the Charpy V Notch (CVN) properties. A prediction of the CVN shear transition for these seams is currently validated and used for pilot projects. The second technique is a new concept that evolved from Nondestructive Toughness Testing (NDTT) using a wedge stylus to Blade Toughness Meter (BTM) which uses a significantly sharper stylus to mimic more closely the conditions at the tip of a crack. In a lab prototype phase, the BTM tester is intended to be adapted for pipe body testing as early validation studies show a stronger correlation with the laboratory toughness results in comparison to NDTT. This paper presents the recent progress and the validation status of both techniques as well as their benefit through initial case studies.
41. ILI Validation Case Study: Evaluating the impact of a weld cap on a vintage ERW pipeline inspected with an ultrasonic crack detection tool
1IDSmith Pipeline Engineering, LONDON, Canada. 2TL Anderson Consulting, Cape Coral, USA
Abstract
An ultrasonic crack detection ILI was run as part of a liquid pipeline’s integrity management program. ILI validation, using API 1163, was performed to determine the effectiveness of the ILI in detecting, identifying and sizing cracks. This case study will discuss the results of the ILI validation with specific focus on the impact of the ILI measurement errors upon the severity assessment of the cracks and different options that were used to account for the errors and maintain desired levels of conservatism.
The most common linear anomaly type in this ERW pipeline was crack like lack of fusion flaws. The pipeline had undertrimmed welds with remaining weld caps and the ILI only specified measurement in the ‘base material’ and would not reliably detect reflectors located in the weld cap. The ILI did not meet its specifications for detection, depth or length accuracy with a tendency to undersize both depth and length. The impact of the weld caps were identified as the primary cause for the errors.
The impact of under prediction of both depth and length on the burst pressure assessment was evaluated. To evaluate the impact of the field found anomalies upon the integrity of the pipeline a FEA assessment was performed using the phased array field verification results upon the most severe anomaly not identified by the ILI to account for excess conservatism in longer cracks with a complex profile. Integrity decision making was made using the context provided by the evaluations of the impact to severity assessments and not solely upon measurement accuracies.
Keywords: ILI Validation, Engineering Assessment, Integrity Management
42. Tool Performance Estimation Considering the Effect of Fixed vs Variable Slope
Integral Engineering, Edmonton, Canada
Abstract
The performance of in-line inspection (ILI) measurements is one of the primary sources of uncertainty for corrosion and crack assessments. Operators typically perform validation digs to determine how well the ILI performed at sizing features. The API Standard 1163, “In-line Inspection Systems Qualification”, defines three levels of analysis that operators use to validate the ILI sizing accuracy. The first level relies on previous experience with the ILI system and adherence to operating procedures, the second level uses validation dig data to determine if the vendor specification can be used, and the third level uses advanced statistical methods to estimate performance from validation dig data.
The recently published third edition of API 1163 provides two example methodologies to perform a level 3 analysis. Both methods make simplifying assumptions to reduce the complexity of the problem, but one of the key differences between them is that the first method assumes the slope of the best-fit line on a unity plot is fixed at 1.0. In this paper, the effect of fixing the slope at 1 to estimate tool performance is investigated and compared against a method where slope is allowed to be variable. Several realistic datasets are evaluated using both methods and the results are compared. The effect on burst pressure for representative corrosion features is also investigated for both methods.
43. Tolerance of ILI Validation Inspections, Why Is It Important, and How to Reduce It.
1ROSEN, Newcastle, United Kingdom. 2ROSEN, houston, USA. 3ROSEN, Houston, USA
Abstract
ILI tools are supplied with a strictly controlled and validated tolerance to apply to integrity calculations in order to make safe engineering decisions. It is a requirement under API 1163 to validate the performance of the ILI tool in the ditch following an ILI campaign with field verification technicians using a range of technologies and procedures. What is the tolerance of the technique being used? And since they are manually applied and dependent on the operator, what is the tolerance associated with the technician?
In contrast to what is commonly assumed, field verifications are not absolute and there can be a significant variation between operators, technologies, and sizing techniques. It is a costly and sometimes complex operation to understand the performance of field verification technicians using a range of technologies, but an important aspect in ensuring compliance and safe operation of pipelines.
This paper discusses the attempts at understanding a universal tolerance by international codes and standards which can be used in conjunction with API 1163, and how these values can be utilized in a validation exercise of ILI tool performance. If these universal values are not suitable then we will discuss how these tolerances can be reduced and measured. We will look at a practical example of this application for inspection of thin walled ERW inspection and the implications of understanding the tolerance of the inspector on the validation process and ultimately the safety of the pipeline network.
44. A novel concept addressing material properties and loading conditions with a dynamic micro-magnetic sensor
ROSEN Technology and Research Center GmbH, Lingen, Germany
Abstract
In 2013/14, an eddy current sensor in a magnetic field for material properties was introduced; together with a population approach that addresses the requirements stated in current U.S. regulations, it determines pipe grade. A novel sensor technology has been developed now, called DMPL (Dynamic Material Properties Loading), which addresses a broader range of material properties, including toughness and, additionally, the axial and circumferential stress condition of a pipeline.
The patent pending technology is a high-resolution non-harmonic micro-magnetic sensor. Essentially, micro-magnetic sensors consist of a magnet yoke, an excitation and a receiving coil to generate and record a hysteresis curve. When testing a component, the generated hysteresis curve contains information about the mechanical properties and the loading conditions of this component. Conventional micro-magnetic sensor applications are mainly used as handheld devices for static local measurements and play a reliable role in quality control of steel plates during manufacturing. To cope with such challenging conditions during in-line inspections as high tool velocities, low power consumption and sensor liftoff, the sensor technology was upgraded and adapted. Using an extensive material database for machine learning is the key factor in this multitalented concept.
This paper provides an introduction of the technology and its suitability in the areas of axial stress condition and material properties demonstrated by laboratory measurements, full-scale tests and first operational experiences. Based on these tests, which comprise a large set of test samples, a first assessment of sizing capabilities is given, and further aspects such as measuring resolution are discussed.
KEYWORD(S) FOR SUBJECT AREA
ILI applications
Stress
Strain
Loading conditions
Strength
Toughness
44. Application of MFL ILI Data for Pipeline Material Verification
1Campos EPC, Denver, USA. 2Novitech Inc, Vaughan, Canada. 3Xcel Energy, Denver, USA
Abstract
Natural gas transmission pipeline operators are required to maintain Traceable, Verifiable, and Complete (TVC) documentation for certain pipe material properties in accordance with United States Federal Code. Pipeline operators are obligated to reconfirm missing TVC material property information. One route of reconfirmation is material verification in accordance with Title 49 CFR 192.607. AMFL and CMFL data from inline inspection is applied in this study to match pipe joints to a specified minimum yield strength (SMYS). This technology application is proposed to provide an alternate methodology to commonly applied destructive and in situ nondestructive test methods. This alternate ILI-based method would reduce compliance costs as well as health and safety exposures associated with pipeline excavation and other activities required to complete destructive testing and in situ nondestructive testing. Material verification using historic ILI MFL data was validated using available TVC documentation as well as destructive and nondestructive test data. Statistical analysis is applied to identify sampling requirements to achieve a 95% confidence level when applying ILI material verification information in combination with destructive testing and/or in situ nondestructive testing data.
Categories: Data management; ILI analysis; materials identification, verification
45. Knowing the Long Seam: Essential Insights Using UHR MFL Technology
Entegra, Indianapolis, USA
Abstract
Metal loss that aligns with a pipe’s long seam poses an imminent integrity threat as well as a threat to an operator’s bottom line. But the impact and potential costs of false calls – both negative and positive – can be mitigated with an integrated ILI system that combines Ultra-High Resolution MFL technology with the insight and assessment of human-experience based data analysis. In this paper, we’ll explore how the ever-growing capabilities of MFL – and the ability to extract nuanced data from it – can improve both outcomes and efficiency.
From coincidental metal loss to preferential metal loss, trim and other manufacturing anomalies, we will investigate state-of-the-art MFL technologies, including their ability to detect ERW and flash-welded pipe and size axially-oriented anomalies. Then we will show how the latest in UHR and its facilitation of DA makes all the difference when assessing pipeline integrity.
46. Making hard decisions
1ROSEN, Columbus, USA. 2Williams, Tulsa, USA
Abstract
The definition of a hard spot is introduced in the updated Gas Rule 49 CFR 192 Part 2 as “an area on steel pipe material with a minimum dimension greater than two inches (50.8 mm) in any direction and hardness greater than or equal to Rockwell 35 HRC (Brinell 327 HB or Vickers 345 HV10)”. This update sets an expectation for operators to manage the threat through a combination of assessment, using ILI and in-ditch validation, and an appropriate response.
Over the past two years, Williams Transco has utilized in-line inspection technology capable of detecting, identifying and characterizing hard spots on several transmission pipeline systems. Various types of reported material hardness anomalies have been subsequently verified in a validation campaign, of which a number occurred on not only flash welded A.O. Smith pipes, but also vintage DSAW pipes from a wide range of manufacturers.
This paper will present the results of extensive non-destructive and destructive testing of validated material hardness anomalies, to establish a thorough understanding of the different types of hard spots that can exist, and discuss recommendations for assessing these anomalies and defining appropriate response options.
47. Validating Selective Seam Weld Corrosion Classification Using ILI Technology
T.D. Williamson, Salt Lake City, USA
Abstract
Selective seam weld corrosion (SSWC) occurs when a susceptible long seam, such as low-frequency electric resistance welding (LF-ERW) manufactured prior to 1970, is subjected to an active corrosion environment. When this occurs, the seam weld corrodes more aggressively than the pipe body, resulting in a deep V-shaped groove aligned with the seam axis. An SSWC anomaly poses a greater threat to pipeline integrity, when compared to a similar volume of general corrosion crossing the long seam (CCLS), due to the aggressive corrosion depth growth rate and orientation to the primary stress.
The pipeline industry has struggled to consistently distinguish between SSWC and CCLS anomalies. In an effort to overcome this gap, T.D. Williamson (TDW) participated in a DOT project that resulted in the development of a SSWC classifier. The classifier leverages the data collected by the Multiple Dataset (MDS) platform. MDS incorporates 5 primary technologies (high-field axial magnetic flux leakage, high-field spiral/helical magnetic flux leakage, low-field axial magnetic flux leakage, high resolution geometry, high resolution mapping), overcoming gaps in each individual technology, providing a comprehensive integrity assessment. The classifier has since been used with various operators to characterize long seam corrosion anomalies.
In 2022, TDW published an industry first specification that characterized the performance of the SSWC classifier. The paper will discuss the statistical backing of the published specification, demonstrating the field data basis and validation. Examples of SSWC and non-SSWC feature classifications will be discussed.
Keywords: In-line Inspection, Corrosion, Corrosion Crossing the Long Seam, Data Science, Multiple Dataset, Magnetic Flux Leakage, Geometry, Deformation, Interacting Features, Precision & Recall, Selective Seam Weld Corrosion, CCLS, DEF, GEO, ILI, MDS, MFL, SMFL, SSWC
48. Development of a Multi-Diameter and Low-pressure Compatible Tool to Inspect for Selective Seam Weld Corrosion
1ROSEN, Houston, USA. 2Enbridge, Houston, USA
Abstract
Enbridge operates a low-pressure multi-diameter natural gas pipeline in the Northeast United States that is susceptible to selective seam weld corrosion (SSWC). The diameter ranges from NPS 24” to NPS 30” with 15 diameter changes over a length of 13.0 miles. SSWC is an environmentally assisted mechanism in which there is increased degree of metal loss in the longitudinal weld in comparison to the surrounding pipe body. Rosen’s RoCorr MFL-C Ultra technology was selected to obtain inspection data in a single in-line inspection for metal loss and long seam features. The multi-diameter and low-pressure operating characteristics of the pipeline presents in-line inspection challenges such as stuck tools, speed excursions and degraded data, particularly when the tool encounters bends and fittings. This paper presents a systematic approach for developing an appropriate in-line inspection tool from the perspective of a natural gas pipeline operator and in-line inspection technology provider, including a description of the in-line inspection execution considerations, in-line inspection tool design and testing process, tool features to mitigated degraded data and field validation results. This case study demonstrates that tool developments for low-pressure and multi-diameter pipelines should be considered as a long-term integrity management strategy.
49. ILI Ultrasonic Shear Wave and Compression Wave Inspections Capabilities for Selective Seam Corrosion (SSC)
1NDT Global, Barcelona, Spain. 2NDT Global, Calgary, Canada. 3NDT Global, Mexico City, Mexico
Abstract
Selective seam corrosion (SSC) can be considered as a complex feature from the Ultrasonic (UT) ILI perspective. The main reason is that it is a metal loss (corrosion) which would infer that a compression wave inspection is the best technology to address it. However, because of its geometry and dimensions it does provides reflections similar to cracks, so the shear wave technology would be optimal to detect narrow corrosions.
These features being at/in the long seam can be a threat to the pipeline and need to be known to the pipeline operator so that the required actions and measurements are taken to ensure the safety of the asset.
This raises the questions: 1- Which UT technology should be used to detect these features? and 2- What are the capabilities of the UT compression wave and shear wave ILI tools in regard to selective seam corrosion (SSC)?
This paper will present the results from a systematic approach where simulations, pull tests, and NDE correlations from ILI runs were performed. As conclusions it will provide the reader a guide on:
50. One Step Ahead: the Italian Experience on Coping with Illegal Tapping
1SolAres Srl, Milan, Italy
Abstract
As widely known and reported by prestigious publications such as CONCAWE reports, the phenomenon of Illegal Tapping in Europe was – and still is, with a much lesser impact – the main cause of concern for pipeline operators, especially in the years from 2015 to 2020.
This presentation aims at providing an insight on a specific country, Italy, which experienced a very high impact over illegal tapping phenomena.
The problem today is considered, if not entirely solved, at least controlled and contained, by looking at today’s numbers related to illegal tapping events. Nevertheless, achieving this result required a process which took several years and the development of an innovative technology, which, coupled with a bold innovation plan on several organizational aspects, led to the success case shown in the presentation.
Looking back to the past, important takeaways can be grasped, most importantly the basic fact that technology alone cannot solve this problem: the reduction of illegal tapping activities/spillages was achieved by developing a multi-disciplinary approach based on technology, engineering, operations, and security.
All the premises above are coupled with the fact that illegal tapping entails the active participation of a malevolent third party, acting and evolving to overcome any implemented strategy and technology.
The past experience can – and currently is – applicable to other scenarios in other parts of the world where the phenomenon is still active or even worse, is entirely at its beginning and finds fertile soil for growth, given the current instable international situation.
51. Challenges Facing Illegal Tapping: Pipeline Protection in Brazil
Petrobras Transporte S.A., Rio de Janeiro, Brazil
Abstract
Illegal tapping is a global phenomenon. Sharing experiences is the key to understanding how to face and prevent this crime. In a positive way, we believe we have created in Brazil the term “Pipeline Protection” as a concept that gathers all diverse initiatives we have been exchanging with some pipeline operating companies from other countries.
We have used a multidisciplinary approach that involves: innovative control room procedures, legal issues, new technologies search, the subtle art of communication with local communities and public security forces.
It is an industry-wide, international endeavor to demonstrate that illegal tapping is not only a concern for operators, but for society as a whole.
52. Use of ILI data to identify illegal tapping
1CENIT, Bogotá, Colombia
Abstract
This presentation will explain development of a methodology to analyze and correlate information from successive, separate MFL ILI inspections to identify illicit valves (taps) in hydrocarbon transportation pipeline systems; generation of recognition patterns for dimensions and configuration of illicit valves; density prediction of areas with greater vulnerability to this threat; consideration of socio-geographic factors along the rights of way.
Deliverables from the project included:
53. Above and Below: A Holistic Geohazard Monitoring Solution
1ROSEN, Houston, USA. 2ROSEN, Newcastle, United Kingdom. 3Teren, Lakewood, USA
Abstract
Geological and hydrological processes continuously reshape the surface of the Earth in ways that are not always predictable or easy to detect. Both cataclysmic and routine weather events are drivers of the geological and sedimentary change that ultimately result in pipeline geohazards. Operators need to consider these processes when constructing new pipelines or managing the integrity of existing assets.
Accounting for the influence of onshore or subsea land movement on structures is the primary goal of any effective geohazard management program. Traditionally, geotechnical monitoring programs are based on distributed point measurements in a defined area of ground movement. Active monitoring of ground movement and pipeline stress states is typically performed with discrete monitoring equipment, such as slope inclinometers or strain gauges. This can provide sufficient information for management of simple pipeline geometries located within basic geological environments and, most importantly, where hazards have already been identified. Frequently, hazards that result in pipeline failures are unmonitored or in areas that do not appear to be problematic, particularly where the surface expression is subtle and not identified by traditional surveillance methods.
To meet the demands placed on operators by advancing regulation and severe weather conditions, more frequent and comprehensive appraisals of pipeline right-of-way corridors will be required. For liquids transmission operators, this occurred in 2019 with 49 CFR 195.414. For gas transmission operators, this will become effective in May 2023 with 49 CFR 192.613.
This paper will demonstrate a holistic and integrated geohazard monitoring solution, which utilizes in-line inertial mapping and electromagnetic stress measurement to assess the condition of the pipeline alongside aerial laser topographical surveys (also known as light detection and ranging, or LiDAR) to evaluate the state of right-of-way at the surface. LiDAR provides invaluable insights into the characteristics of the land surface and whether there are features or anomalies that could represent land instability. Inertial mapping reveals the occurrence of discrete flexural loading and its proximity to performance limits. Additionally, recent case studies have shown the ability of new ILI technologies to accurately measure uniform longitudinal stress resulting from axial loading on pipelines. The integration of these three data collection techniques ultimately results in a high level of confidence when diagnosing and characterizing active geohazard threats.
This approach not only provides the ability to identify geohazards, but also assists with setting appropriate inspection intervals to track changes to pipeline integrity and hazard development. An additional advantage of these complementary technologies is that they provide a robust baseline for any geotechnical program and increased efficacy in the design of site surveys, the selection of monitoring points and guidance toward the most appropriate remediation solution.
54. How should we respond to geohazards?
1D2 Integrity, LLC, Houston, USA. 2Geosyntec Consultants, Inc., The Woodlands, USA
Abstract
The threat from geohazards has received increased awareness from operators and increased scrutiny from regulators over the last decade. Most recently the Pipeline and Hazardous Materials Safety Administration (PHMSA) issued an advisory bulletin to highlight the importance for integrity management related to the potential for damage to pipeline facilities caused by earth movement and other geological hazards. The elevated attention from operators has resulted in an increased interest in and use of both bending strain and in-situ site assessments for the identification and assessment of geohazards. However, after properly identifying and assessing a site, many operators experience challenges in determining an appropriate integrity response. Historical integrity practices based on corrosion or crack management have relied upon excavation as a first step in remediation with follow-up responses based on in the ditch findings. Unfortunately, this process is typically not a best practice for geohazards. The excavations are often significantly larger, the site conditions may be less stable, and typical remediations such as sleeves or composites are not practical. This paper will serve as a guideline for helping operators responding to a geohazard threat by providing guidance on data collection, mitigation, and future monitoring.
55. Management of Geohazard Personnel Safety for Working in Challenging Terrain
1Pacific Northern Gas, Vancouver, Canada. 2Pacific Northern Gas, Terrace, Canada. 3BGC ENGINEERING INC., Vancouver, Canada
Abstract
Pacific Northern Gas Ltd. (PNG) owns and operates sweet dry natural gas systems with service extending from Prince Rupert on the British Columbia West Coast to the northeast of the province in the towns of Fort St. John, Dawson Creek, and Tumbler Ridge. PNG’s transmission system operates at high pressures and traverses through one of the most rugged and challenging terrains in North America, with unique weather and geohazard challenges.
There has been an increased focus on the integrity and maintenance of PNG’s assets to ensure a safe and reliable energy supply to the communities. This has led to a considerable increase in the scale and size of PNG’s in-line inspection (ILI) program and, consequently, the associated field activities (e.g., ILI runs, pig barrel modifications, integrity digs, regular maintenance and system betterment projects, etc.) on the pipeline system. This requires field operations in proximity to geohazards and potentially unstable terrain, posing a significant personnel safety risk to the field crews. This presented an opportunity for the development of a management tool to support planning and field-level safety decisions.
A Geohazard Situational Awareness Tool has been developed in collaboration with BGC Engineering (BGC) to manage the identified field safety risks during the construction season. This tool is based on the PNG’s baseline geohazard assessment findings, more specifically, earth and rock slope hazards, debris flow and debris flood hazard crossings, and hydrological hazards of river crossings and rivers in close proximity to the PNG right of way. This tool provides automatic and semi-automatic daily recommendations on the geohazard safety risks based on predictions supported by weather data and hindcasting/forecasting. This tool enables PNG to make field-level risk-based decisions about short-term fieldwork planning and execution to ensure the safe completion of the associated field activities.
This article will present PNG and BGC’s challenges and successes in developing and implementing this pioneer solution for managing identified geohazard risks to personnel safety during the fieldwork season. The intent of this paper is to ensure other operators are aware of the available options to manage personnel safety for working in high-risk geohazard terrains.
Keywords: geohazard, personnel safety, gas pipeline, risk analysis
56. Leveraging Engineering Assessments and Engineering Critical Assessments for an enhanced and practical approach to evaluating pipeline conditions
1Dynamic Risk Assessment Systems, Inc., Calgary, Canada. 2Time For Change, LLC., Houston, USA
Abstract
Engineering Critical Assessments (ECA) have been incorporated into United States pipeline safety regulations (§192.632) as a means for reconfirming the Maximum Allowable Operating Pressure (MAOP) for onshore steel gas transmission pipelines while Engineering Assessments (EA) have been a longstanding method for proving consistent conclusions and recommendations across a variety of situations in accordance with the Canadian standards and guidance in CSA Z662:19. The purpose of this paper is to discuss the similarities and differences in the approach of ECAs and EAs while offering practical considerations to improve the resulting assessments conducted. The findings of a recently conducted EA with a semi-quantitative risk assessment will be discussed as an example of how engineering principles and a threat perspective supplement the algorithm generated results. The primarily fracture-mechanics basis of ECAs, similarly, can be enhanced when a broader, threat perspective is applied. Practical considerations will be discussed with applications geared to responding to new regulations and utilizing sound engineering consideration to a variety of pipeline engineering assessments.
Topics of Discussion
Abstract: Pipeline Risk Forum
57. Room Temperature Time Dependent Creep Behavior of Low Frequency ERW Pipe Seams and Implications on Managing Pressure Reversals in Hydrostatic Tests
1Center for Reliable Energy Systems, Dublin, USA. 2Enterprise Products, Houston, USA
Abstract
The presence of low frequency (LF) ERW seam weld defects (e.g., lack of fusion, stitching, and hook cracks) can reduce the pressure-carrying capacity of a line pipe. In cases where these defects may have been subjected to a hydrostatic test, there is a possibility that the seam weld defects could fail at a lower pressure upon re-pressurization. This type of failure, which occurs at a pressure less than the previous pressure and where no time dependent degradation has contributed, is commonly referred to as a pressure reversal.
LF ERW seam flaws can fail when held at a constant load below the straight-off to failure load. This is because ductile materials can exhibit time-dependent creep behavior even at room temperature. Evidence of time dependent behavior is provided by failures that occur during the maximum pressure hold period of a hydrostatic test.
Time dependent growth and reverse yielding can be detrimental when performing multiple high pressure hydrostatic tests which can result in many blowouts during the hydrotests, and flaws that survive the hydrotest may experience some ductile tearing that could be detrimental to fatigue life.
This paper covers:
The testing methodology is successful in showing the time-dependent creep behavior of the bondline flaws at elevated loads, as well as establishing that after reducing the pressure down to zero and back to load, the time dependent creep behavior could be re-activated.
58. Accounting for Residual Stress in the Predicted Failure Pressure Calculation
1RSI Pipeline Solutions LLC, New Albany, Ohio, USA, 2Pacific Gas and Electric, San Ramon, USA
Abstract
Pipeline safety regulations require performing a calculation of the predicted failure pressure (PFP) of defects as part of an engineering critical assessment. Whether to include residual stress from pipe manufacturing, and selecting the magnitude of residual stress, can significantly affect the outcome of PFP calculation. Guidance for accounting for residual stress is inconsistent. A survey was performed of several dozen research reports describing testing and analyses of residual stresses induced by the pipe manufacturing process for various types of line pipe. A simple method for determining whether to account for residual stress, and if so, at what magnitude, has been devised for various categories of ERW pipe, and also for non-ERW pipe.
59. Estimate Pressure at Feature Location in a Complex Pipeline System
Phillips 66, Houston, USA
Abstract
Determining the pressure level at a feature location in a pipeline is critical for further assessment, such as comparing it with calculated burst pressure, or deriving the local pressure spectrum over time for fatigue evaluation. Currently, API RP 1176 (2016 First Edition) Section 8 provides an equation to estimate local pressure based on immediate upstream and downstream pressure gauge records and the location of the feature. This equation is useful for a simple pipeline with uniform flowrate and up to two pipe segments with different diameters between two pressure gauges. However, real pipeline systems can be more complex. For example, a pipeline segment, located between two pressure transmitters, may be composed of a large diameter subsegment in between two smaller diameter subsegments. The pipeline segment may also include injection or strip off points between the gauges which results in different flowrate along sections of the segment. In this paper, a more universal approach with a group of equations was developed which can calculate the local pressure in a complex pipeline with any number of subsegment of various diameters and flowrates. The methods reduce to the one in API RP 1176 for a simple pipeline system. Working examples are also provided to demonstrate the application.
60. Effect of pipe-soil interaction parameters on pipeline thermal stress analysis
¹DNV Canada Ltd., Calgary, Canada, ²Northern Crescent Inc.
Abstract
Thermal stress analysis is an integral part of the design and integrity assessment of buried pipelines. In the current industry practice, the numerical beam-spring model is extensively used for the stress analysis of buried pipelines under operational (e.g. temperature and pressure) loads. In the beam-spring model, the pipe-soil interaction is simulated using a series of orthogonal soil springs aligned in the axial, lateral, vertical upward and vertical downward directions as recommended by American Lifelines Alliance (ALA) and Pipeline Research Council International (PRCI) guidelines. This paper reviews the assumptions and limitations of the existing methods for structural pipe-soil interaction modelling and investigates the sensitivity of pipe stress values to the pipe-soil interaction parameters using finite element (FE) analysis. The commercial FE software package, Abaqus is used in the present study. A case study mimicked to an actual pipeline is used in the present study to see the practical effects of using different pipe-soil interaction parameters. Results show a significant dependence of the pipeline stresses not only on the pipe-soil interaction parameters but also on using the different design guidelines. The variation in the pipeline stress responses from the FE results indicates that the estimated pipe-soil interaction parameters obtained from different guidelines need to be consistent enough to simulate pipeline stress response under pressure and temperature loading.
61. Know When Using MFL for Effective Area is Wrong!
1D2 Integrity, Houston, USA
Abstract
Performing corrosion assessments on reported MFL features is a fundamental competency in pipeline integrity management. ASME B31.G provides three methods of calculating burst pressure associated with defect assessment for corrosion, namely B31.G, Modified B31.G, and Effective Area. Each method is based on a geometry and depth profile of the corrosion defect, which may be explicit or an approximation. The technical documentation for each methodology’s application is widely available and well understood. However, the transformation of MFL signal data into metal loss feature characterization as a function of feature length, width, and depth for use in Effective Area calculations is not well understood. If the MFL based depth profile is not representative of the corrosion defect, then the burst calculation using the Effective Area methodology may not be conservative and potentially a safety concern. This paper will use a case study where MFL-A technology was incorrectly used to calculate burst pressure using the Effective Area methodology, highlight MFL technology’s challenge in providing accurate corrosion depth profiles to perform Effective Area calculations, and share guidance on how to qualify MFL data for use in Effective Area calculations.
62. Overcoming detection and sizing challenges for slanted/skewed cracking by combining axial and circumferential crack detection In-line inspections
1NDT Global, Barcelona, Spain. 2NDT Global, Houston, USA
Abstract
Pipeline operators widely use In-line inspection (ILI) ultrasonic tools to manage their integrity. Specifically for cracking related threats, tool selection will be driven by many factors, one being the crack orientation in relation to the pipe axis. Axial linear anomalies such as; fatigue cracks, lack of fusion and stress corrosion cracking (SCC) can be present due to fatigue, manufacturing related issues, or environmental conditions that favor their development. For circumferential linear anomalies it is not that different, these conditions will also impact their time-dependency state.
Measurement techniques used for crack detection have boundary conditions such as minimum length and depth, but more importantly, the deviation angle from the pipe axis or the circumferential axis will directly have an impact in the ILI tool measurement that will result in an analysis bias to undersize the depth or in a worst case scenario, directly limit the possibility of the feature being analyzed due to signal amplitudes within noise levels and/or below analysis thresholds.
During a field verification campaign of vintage pipe, areas with SCC were uncovered for which the geometries were found to be slanted over the pipe body following areas of coating disbondment. The pipeline had been inspected with both; axial and circumferential crack detection tools which allowed further integration of the data and the possibility to derive a methodology, that is reproducible, providing the user trustworthy and actionable data.
This paper will address the detection challenges of the ILI technology while documenting the necessary steps (incl. non-standard analysis) to derive a methodology that led to improved reporting and depth sizing
KEYWORDS FOR SUBJECT AREA: ultrasonic tools, stress corrosion cracking, spider web cracking, depth sizing, correlation
62. Pressure Reduction Determination Through Reverse Failure Pressure Modeling and Staggered Implementation
DynamicRisk, Spring, USA
Abstract
When an integrity-related condition that could impair the serviceability of a pipeline is identified or suspected, operators may consider temporary restrictions or reduced operating pressures as both an immediate response and during subsequent maintenance activities. Pressure reductions lower operating stresses and effectively mitigate the immediate integrity threats posed by such condition for a period of time – thus reducing asset risk. North American pipeline regulations, industry standards, and operator standard practices provide various levels of guidance regarding failure pressure modelling and pressure reductions as a response to identified or suspected conditions. However, these practices require known or assumed values to complete failure pressure models and obtain meaningful pressure reductions. Those operators aiming to use “known” data in the models may be required to perform direct inspections or extensive record review to collect such data; if “assumed” values are utilized, results may lead to overly conservative pressure reductions and unnecessary disruptions in business operation. This paper provides a process to determine critical flaw sizes and resultant pressure reductions for time-dependent threats that account for “unknown” or low-confidence data by reversing the failure pressure equations for a given model. Supporting case studies are provided as examples in application of this methodology, including guidance on implementing staggered pressure reductions.
63. Leveraging ILI Crack Profiles
1Enbridge Liquids Pipelines, Edmonton, Canada. 2Baker Hughes, Stutensee, Germany
Abstract
As an ultrasonic crack in-line inspection tool probes a crack, the depth at each ‘ping’ return can be estimated from the amplitude vs depth algorithm. The result is a crack ‘profile’. Leveraging this profile as part of integrity decision-making is not a new notion, and represents a natural progression from legacy rectangular, to (current) semi-elliptical, and finally to equivalent fracture ellipse based on the profile. With technological advancements in the past decade on both the ILI and in-the-ditch crack assessment sides, sufficient data quality and quantity exist to judge whether consideration of crack UTCD ILI profiles is appropriate for integrity decision-making.
64. Burst Pressure Prediction for Axial Cracks in Pipelines with Complex Profiles
1Integral Engineering, Edmonton, Canada. 2TL Anderson Consulting, Cape Coral, USA
Abstract
Crack-like anomalies in pipelines are complex features that typically have an irregular profile. However, due to modelling complexity, the common practice is to approximate such profiles with a semi-elliptical crack whose length is equal to the total flaw length and whose depth corresponds to the maximum depth of the flaw. This approach is very conservative and can result in significant underestimates of burst pressure.
This paper describes recent improvements to the PRCI MAT-8 fracture model that account for arbitrary crack profiles. An extensive finite element study was undertaken to model numerous non-ideal longitudinal crack profiles in pipe joints. The output from these analyses led to a procedure to convert an arbitrary crack profile into an equivalent semi-elliptical crack. The depth of the equivalent crack is equal to the maximum flaw depth, but the length is typically much less than the total flaw length. This modification results in burst pressure estimates that are more accurate and less conservative than the traditional approach.
The procedure improves upon an earlier phase of work (PPIM 2019) that developed an approach which was accurate for cracks with an isolated deeper section that dominates the fracture demand. Since then, more real-world profiles have been assessed and several cases identified for which the previous procedure underestimated the fracture demand. The new procedure resolves this while ensuring a slight conservative bias and maintaining an accuracy that is comparable to typical inline inspection tool length sizing accuracy.
The new algorithm considers interactions between deeper sections of the crack profile to increase the length of the equivalent semi-elliptical crack. While the new algorithm was developed and calibrated using machine learning techniques, it can be implemented without any specialized machine learning tools.
65. Phenomenology and Traits of SCC – and the ILI Challenge it Presents
Worthington, Worthington, USA
Abstract
Recent work considered the factors controlling SCC and typical cracking speeds based on laboratory test data to identify the factors and quantify the laboratory speeds, which it used to formulate bathtub speed curves that compared favorably to typical field cracking speeds. This paper adds significantly to the hundreds of cracks in the field dataset considered previously. Traits typical of the field cracking are trended and compared with current ILI crack-tool reporting criteria to identify their strengths and potential weaknesses concerning safety and reliability.
Fracture features typical of ruptures and major spills due to SCC are contrasted to those evident for leaks and larger secondary cracking, for benign field cracking, and finally for field cracking at the scale of the steel’s microstructure. It is shown that regardless of the scale the recurrent traits of failures causing ruptures and major spills are comparable down to the smallest of cracking – indicating that the mechanics of SCC is scalable. The associated crack populations are then trended relative to their spacing and sizing as evident on the pipe’s OD surface, on its fracture surfaces, or in x-sections of intact cracking. The resulting populations of surface lengths and profiled depths are then trended for well in excess of a 1000 cracks. That population was then parsed based on their sizes and field response as 1) benign, 2) secondary cracks remote to ruptures and major spills, 3) larger secondary cracks adjacent to ruptures and major spills, leaks and smaller spills, and finally 4) ruptures and major spills.
The parsed dataset was then trended relative to a normalized form of crack aspect ratio as a function of normalized of depth, which effectively discriminated between each of the four parsed datasets. The usual crack-tool reporting criteria specified relative to length and depth were then recast as a function of pipe diameter and wall thickness, such that they could be contrasted with the field data. This identified what amongst this field population would be reported if the tool successfully identified and called each of the cracks. The results showed that the current criteria cull the benign cracking and the smaller secondary features, and report all outcomes that led to ruptures and major spills. Thus, the reporting criteria avoid digs for benign cracking, and successfully capture cracking that poses immediate concern for failure. While effective as just noted, portions of the population that are reaching sizes that have posed a threat in past are less effectively reported. The results indicate that depth is not a key factor in this outcome – rather it was controlled by crack length. This, coupled with the observation that crack length is underreported to an extent controlled by aspect ratio, suggests improved safety and reliability could be affected significantly by improvements in length sizing and length reporting. These aspects are elaborated further in the paper.
KEYWORDS FOR SUBJECT AREA: Crack assessment, ILI applications
66. Fatigue Testing (Small and Full Scale) Validation of SCC Recoating
1Blade Energy Partners, Houston, USA. 2TC Energy, Calgary, Canada
Abstract
For gas pipelines it is important to identify SCC colonies that can be recoated without grinding and operate for another 50+ years. One of the key elements of this study was the small scale and full-scale fatigue testing of SCC colonies for validation. The focus of this paper is on the testing methodology and results.
The fatigue testing was conducted in the base metal, weld and HAZ. Small scale testing was first utilized to establish the baseline behavior along with J-R data. The full-scale testing was conducted in pre-existing SCC colonies in the base metal and utilized application of hydraulically pressurized water.
For the weld region, SCC cracks were not adjacent to the weld, consequently a crack was generated using an EDM notch. The crack growth in the full-scale ring-samples was generated using a servo-hydraulic machine. This required development of a specialized K solution using FEA.
The nature of the fatigue cracking was matched between small- and full-scale testing using SEM analysis of the fracture surface. Integrated analysis of the small scale, full scale and fractographic results validated more than 50 years of remaining fatigue life for recoated SCC cracks in gas pipelines.
67. From One to Many – Composite Repair of SCC
1ADV Integrity, Waller, USA, 2CSNRI, Houston, USA, 3Williams, Salt Lake City, USA
Abstract
Composite repairs have been traditionally utilized as a means to repair features identified on pipeline systems including corrosion and dents. Recently, several industry-based studies have been performed to investigate the repair of longitudinal cracks and crack-like features. These studies demonstrated the ability to reinforce crack and crack-like indications, however, were reinforced with overdesigned repair thicknesses and only repaired a singular approximately 3-inch-long crack. While this is conservative, additional layers increase cost and complexity of the repair.
This paper summarizes a two-phase program utilizing pipe containing field-identified colonies of stress corrosion cracking. Phase 1 of the testing program utilized nominal 30-inch OD x 0.325-inch WT, API 5L, Grade X52 pipe material and Phase 2 of the testing program utilized nominal 10-inch OD x 0.188-inch WT, API 5L, Grade X52 material.
Varying repair thicknesses were installed to further investigate the ability of a carbon fiber composite repair system to reinforce SCC indications of varying lengths and depths. Additionally, one sample during both testing phases was repaired while under pressure. To accomplish a comparison between samples, several criteria were compared: the ability to survive full-scale pressure cycling and subsequent burst test, a reduction in strain measured across repaired crack-like indications, and any subsequent growth identified after completion of the full-scale tests.
68. Measuring Toughness with Instrumented Indentation Methods: Fact or Fiction?
TL Anderson Consulting, Cape Coral, USA
Abstract
There is a strong desire among pipeline operators to quantify material properties with nondestructive in-ditch measurements. In addition to operators’ obvious motivation to maintain pipeline integrity and to avoid releases, PHMSA’s new Mega Rule for vintage gas lines imposes regulatory pressure to characterize pipe properties. Performing destructive material testing on cut-outs is an effective but very expensive option. Consequently, the prospect of nondestructive in-ditch material testing is extremely attractive.
A number of vendors offer in-ditch technology to infer yield and tensile strength. One such technology entails pressing a small spherical indenter into exposed steel on the OD of a pipe joint. This technique resembles a conventional hardness test, except that these modern indentation devices are instrumented to measure the force versus deflection response.
While instrumented indentation methods are certainly capable of measuring the strength properties of steel, some vendors have claimed that this technology can also measure material toughness. The present paper examines this claim in detail.
The author invokes basic metallurgical principles to argue that it is simply impossible for an indentation test to “measure” fracture toughness. The plastic flow properties of steel are weakly related to fracture properties. That is, two steels with identical strength properties can have very different toughness properties. The indentation test cannot distinguish between two such steels. This paper includes experimental benchmarks that demonstrate the lack of correlation between tensile properties and fracture toughness.
69. A Simplified Implementation to Estimate the Upper Shelf Energy and Transition Temperature from Limited Charpy V-Notch Data Sets
1American University of Iraq, Sulaimani, Sulaymaniyah, Iraq. 2RSI -Pipeline Solutions, New Albany, USA. 3Pacific Gas and Electric, San Ramon, USA. 4RSI -Pipeline Solutions, Oklahoma City, USA
Abstract
Pipeline feature toughness is a critical input for fitness for service assessments and MAOP reconfirmation based on the ECA approach. For these applications, toughness has historically been estimated from laboratory Charpy V-Notch (CVN) testing via the Upper Shelf Energy (USE) and 85% Shear Appearance (ductile to brittle) Transition Temperature (SATT). Two approaches are widely accepted for estimation of the USE and SATT from a set of CVN tests performed over a range of temperatures: (1) curve fitting a hyperbolic tangent to the experimental data, and (2) analytical solution of a system of empirical equations.
From a practical perspective, the unconstrained curve fitting method (1) is only accurate when the test data span a sufficient range of temperatures to sample both the lower and upper shelves and contain multiple points in the transition region. Additionally curve fitting is a manual, time-consuming procedure with poor repeatability.
Because of these challenges, pipeline operators often use the analytical solution method (2) that was originally proposed by Rosenfeld (Oil and Gas Journal, 1997) and later implemented in API-579 9F.2.2. However, this approach uses assumptions that can lead to over- or under-conservative estimates of toughness. Additionally, the uncertainty associated with the solution has not been quantified. As a result, both approaches often require the pipeline operator to accept unknown and potentially significant uncertainty in their toughness estimates.
This paper will provide a consistent and repeatable method to estimate the ductile to brittle transition temperature and upper shelf energy for CVN data that is applicable to any pipeline regardless of vintage. The method utilizes the hyperbolic tangent approach by applying several simplifying assumptions to effectively constrain the curve fitting to a physically meaningful range without compromising the accuracy of the solution. It will be shown that this approach increases the accuracy and reliability of the calculated values for incomplete datasets. We will identify the physical meaning of the assumptions and show how to estimate the uncertainty such that conservatism can be maintained for subsequent calculations compared to other methods.
70. CVN or CTOD for Pipeline Fracture Mechanics? An Overview of Advantages and Disadvantages
Stress Engineering Services, Inc., Houston, USA
Abstract
The longitudinal seam weld fracture toughness of 36-inch OD x 0.406-inch WT, Gr. X52 pipe was evaluated using both Charpy V-notch (CVN) and Crack Tip Opening Displacement (CTOD) testing. Both testing results were converted to the fracture toughness parameter, K, using the methodology outlined in API 579-1/ASME FFS-1 Annex 9F. The correlations between fracture toughness and CVN data results in a large range of toughness values. However, the correlation between fracture toughness and CTOD data results in a single toughness value. This paper describes the fracture toughness calculations and how these results are implemented for pipeline fracture mechanics analyses. This is relevant to engineers and managers as it shows the technical differences between completing CVN vs. CTOD testing for pipeline integrity management assessments.
71. A Case Study of Crack Diagnosis in Natural Gas Liquid Pipelines
1NDT-Global, Houston, USA. 2NDT-Global, Stutensee, Germany
Abstract
Natural Gas Liquids (NGL) are a group of hydrocarbons that are a biproduct of natural gas processing and refining including ethane, propane, normal butane, isobutane, and pentanes plus also known as natural gasoline. As the infrastructure to aid in the exportation for NGL’s have grown so have the requirements to safeguard the assets that are used to transport these liquids by utilizing in-line inspection technologies.
This case study will focus on the deployment of an ultrasonic in-line inspection technology in an NGL Line as well as comparison of crack data analysis from the tool and NDE data from field verifications. The service was deployed for a north American customer to diagnose the potential for hook cracks in their 154 mile, 18” pipeline.
The main challenge that had to be overcome was configuring the service to properly diagnose potential cracks in the pipeline given that the medium for this inspection differed significantly from typical liquid inspection mediums regarding sound velocity and attenuation.
Results from data analysis from the ILI service showed accurate detection and identification of crack like features and were validated with NDE phased array UT measurements which characterized these complex crack geometries.
72. Failure Analyses and Consequent Mitigation: Case Studies
Blade Energy Partners, Houston, USA
Abstract
It is well established that pipelines have the fewest fatalities of any of the various modes of transportation. Failures do occur, however, for a variety of reasons. In this paper, cases of failure due to SCC, weld defects and hydrogen-assisted cracking are analyzed with interdisciplinary approach that combines metallography/fractography, environmental chemistry, fracture mechanics and hydrostatic/ILI based assessment to identify root cause of the failures. Lessons learned from each of the cases analyzed serve as a basis for development of improved integrity management plan for prevention and will be presented in the paper.
For illustration, analysis of an onshore natural gas pipeline that failed recently in South America is shown here. Fractographic analysis with high-resolution matting fracture surface technique identified hydrogen assisted cracking is the mechanism for the failure while the source of hydrogen was driven by cathodic protection operated at near − 1200 mV CSE. Microstructural analysis showed no hard spots associated with the failure. API 579 FAD Level-3 tearing instability analysis confirmed that critical crack size was 90% deep x73 mm long that is consistent with macro-fractographic analysis based on chevron marks and the failure pressure. From the lesson learned, improvement of the distribution and control of the cathodic protection current is critical to avoid high generation of hydrogen at sites where the coating is broken or has faults
73. Optimizing a Reassessment Plan with Probabilistic Monte Carlo Analysis: A Summary of Recent Developments to Better Support Operational Decision-Making
1Quest Integrity, Boulder, CO, USA. 2TL Anderson Consulting, Cape Coral, FL, USA
Abstract
The economic conditions surrounding the oil and gas industry are in a permanent state of flux. Pipeline operators constantly need to evaluate different options for managing their assets to achieve the greatest potential commercial benefit without sacrificing safety and reliability. Seam weld integrity continues to be one of the most challenging threats for pipeline operators to manage. The continued improvement of crack-detection ILI technology provides operators with more options for reassessment, as it may be more prudent to deploy this technology for assets that have been previously managed with hydrotesting only.
The probabilistic analysis methodology discussed in this paper focuses on the management of crack-like features in the pipeline longitudinal seam weld. TL Anderson Consulting and Quest Integrity have developed an industry-leading probabilistic model to assess the seam weld integrity threat (this model has been presented at multiple past PPIM conferences and other industry events). This paper will present an overview of recent improvements to the model which will enable operators to identify an optimal reassessment plan. These recent improvements will provide pipeline operators with direct answers to the following questions:
The probabilistic analysis methodology presented in this paper will quantify the probability of failure over time associated with multiple future hydrotest and ILI scenarios. Specifically with regards to ILI, this analysis methodology will identify the expected number of required repairs following the inspection and the corresponding reinspection interval in order to maintain an acceptable level of reliability. This information is critical for pipeline operators to decide whether to move forward with ILI or hydrotesting as the primary strategy for reassessment.
74. Determining Active vs Passive Internal Corrosion using Data Science
1OneBridge Solutions, Boise, USA
Abstract
Integrity engineers struggle with determining active vs passive internal corrosion, specifically on legacy pipelines with a history of internal corrosion. ILI tools typically under-call internal metal loss anomalies and each ILI tool vendor has different pitting algorithms. This can create issues when attempting to compare run to run data. There may be a mix of over- and under-called anomalies throughout the entire population that when compared on a system level, can create a false narrative that the corrosion is not active or severe.
This research considers two methods that address this problem: specific identification of newly-replaced pipe and an analysis of the distribution of localized pit-to-pit anomaly growth values. Pipe sections that have been replaced between ILI runs essentially act as large coupons, providing valuable data about the active growth of internal corrosion. The second model uses a localized corrosion growth score based on the mean, standard deviation and skewness of the distribution of individual pit-to-pit anomaly growth measurements. Constituent anomalies for the growth distributions are accumulated in sections spanning roughly 500 feet, designed to be sensitive to local corrosion conditions. Using this approach, will reduce the influence of tool bias and provide operators with a ranking system based on a calculated growth score to understand where they have a high density of active internal corrosion and where severe internal corrosion is occurring.
75. Integrity Planning Utilizing In-Line Inspection Data
Acuren, Calgary, Canada
Abstract
Three in-line inspection (ILI) runs were done on a 10-inch Grade X52 sour gas pipeline which was constructed in 2009. There was suspected oxygen ingress early in the operating life of the pipeline and uninhibited methanol was regularly used in the pipeline. The ILIs were completed in 2010, 2015, and 2020. The first run identified 789 internal metal loss features with the deepest feature being 41% of wall thickness deep. The second run identified 1917 internal metal loss features with the deepest feature being 55% of wall thickness deep. The third run identified 3812 internal metal loss features and 494 cluster anomalies and reported the deepest metal loss feature to be 80% of wall thickness deep.
Probability of Exceedance (POE) analysis was utilized to assess the 2020 ILI data due to the significant degradation being found in the pipeline. The work presented in this paper utilized the ILI and subsequent integrity dig data to further support the POE analysis. Upon receipt of 2020 ILI data, the internal corrosion features were characterized, first, and the burst pressure for each feature was calculated. Based on the calculated burst pressure, it was recommended that the pipeline maximum operating pressure (MOP) be lowered from the original 9,930 kPa to 5,500 kPa to reduce the number of required immediate repairs. Next, a POE analysis was conducted using the calculated unmitigated corrosion rate and the recommended reduced MOP. Features which exceeded the specified POE threshold from Year 0 to Year 5 were identified and integrity digs for the identified joints were prioritized and recommended to the pipeline operator.
After completion of the integrity digs and direct inspection of the pipe, the 2020 ILI run was regraded, and the POE analysis was updated. Additional findings from the inspection associated with blisters and cracking were addressed and added into the integrity program along with the POE assessment.
This paper provides details of the ILI data analysis, corrosion rate calculation, and the methodology used to prioritize the integrity digs. In addition, the incorporation of integrity dig data into refining the future integrity program and updating the POE assessment is discussed.
76. Application of Advanced Data Analytics to Improve Metal Loss Tolerance Specifications
¹Baker Hughes, Calgary, Canada, ²TC Energy, Calgary, Canada
Abstract
In recent years there has been greater and greater desire to reduce pipeline maintenance costs through improvements to the effectiveness and efficiency of integrity management programs. Extracting as much information out of data obtained through each In-line Inspection (ILI) to better understand sizing tolerance performance and accuracy is an area of key interest as it has direct impact on repair decisions. Today, higher data volumes captured through multiple sensing techniques are being collected by ILI tools than ever before and the interpreted results are established as one of the most effective assessment techniques for managing pipeline safety.
In addition to this improved condition assessment data, validation programs are generating exponentially increasing volumes of now highly reliable and accurate truth data. This essential combination of high-quality inspection and validation data provides the opportunity to re-think how we establish performance specifications for the different ILI technologies. Traditional methods of utilizing relatively low volumes of isolated artificial defects that attempt to represent defects expected to be found can be replaced with vast ranges of actual real-world defects. Extensive “Big Data” libraries of high-resolution field measurements married to raw signal data captured by the tools provides new and exciting opportunities for innovative improvements that can be made to the detection, characterization and sizing of pipeline anomalies.
This paper will present a machine learned technique applied to vast quantities of dig and tool data to improve metal loss (corrosion) sizing tolerance performance. This method goes beyond the common industry practice to divide metal loss into a small number of categories based on arbitrary discrete defect length and width to include a much wider range of factors that truly affect Magnetic Flux Leakage (MFL) metal loss sizing to predict an individual defect-by-defect tolerance. This provides a more precise prediction of metal loss tolerances that reduces the general conservatism that has been built into existing tolerance specifications over the years while maintaining the necessary conservatism when needed to ensure pipeline safety. This paper will also present examples of the specific benefits operators may realize utilizing these newly predicted tolerance specifications.
77. Tool Tolerances in MFL In-line Inspection and Why They’re Needed
1KMAX Inspection, Millcreek, USA. 2KMAX Inspection, Toronto, Canada
Abstract
While the principle of magnetic flux leakage is relatively simple, it’s application in in-line inspection of carbon steel pipe is far more complex. MFL system design and analysis encompass complex interactions between the magnetic field and flux leakage produced by defects in the pipe wall, making signal identification & interpretation difficult. Thus, the need for tool tolerances.
This paper discusses the cause and effect of wide-ranging factors which influence the reported depths & dimensions of MFL In-line Inspection data. Including,
78. Proof of Performance: Flow-Loop-Testing Validation of UHR MFL Technology in the POD, POI and Sizing of Pinholes
Entegra, Houston, USA
Abstract
A major liquid pipeline operator with assets throughout Texas and the Midwestern United States recently engaged us in a blind flow loop test to compare the pinhole detection, characterization, and sizing capabilities of Ultra-High Resolution (UHR) Magnetic Flux Leakage (MFL) vs. their legacy state-of-the-art Ultrasonic In-Line Inspection (ILI) results.
Testing was carried out at PRCI’s Technology Development Center in Houston, Texas. This paper will discuss how the latest advancements in MFL technology impact true pinhole assessment and will present the flow loop test setup, execution and results.
79. Benefits of MFL Robotic Pipeline Inspection in Assessing Difficult-to-Assess Pipelines
1TC Energy, Charleston, USA. 2Intero Integrity Services, Toronto, Canada
Abstract
The robotic inline inspection method has been utilized by distribution and transmission pipeline operators for over a decade. Since its inception, many advancements have been made. This paper discusses the implications and applications of some recent advancements. Furthermore, TC Energy and Intero Integrity Services will discuss the operational benefits of using MFL robotic pipeline inspection for two difficult-to-inspect pipelines by drawing experiences from using robotics in a 20-inch pipeline and an 8-inch pipeline.
79. Dig Data Warehouse to Enable ILI Continuous Improvement
Onstream Pipeline Inspection Services Inc., Calgary, Canada
Abstract
In order to improve various facets of the ILI product cycle, including sizing accuracy, anomaly or feature identification, and repeatability of inspections a dig data warehouse is needed. Traditionally different vendors and operators have internal formats for this data which can be difficult to use in validating and comparing results across multiple inspections.
To be effective and enable future research, the breadth of data captured in the warehouse, is formatted in a standard format, includes raw inspection data, pipeline metadata, analysis results, and dig measurements including raw laser scan data. The increased in the confidence of ditch measurement enables better trend analysis and adjustment of ILI sizing models. New data signals can also be compared to signals in the warehouse to help identify and classify against verified signals reducing any analysis bias.
This paper will describe the methodology for capturing and utilizing this data to both close the loop of the ILI continuous improvement cycle and provide feedback to customers on the ILI tool performance in the field.
79. Meet the Transformer Robots in Disguise
1Onstream Pipeline, Calgary, Canada. 2Enbridge, London, Canada
Abstract
Gas storage is a critical infrastructure that provides the ability to balance natural gas transmission systems to meet short- and long-term user demands. Natural gas can be stored in above ground facilities, and below ground in caverns and rock formations. There are over 400 active gas storage facilities throughout the North America that provide over 20% of the natural gas required to meet the seasonal winter month demand. These storage facilities are part of the gas transmission network and are directly tied to the system to be accessed as needed. Given the criticality of the natural gas storage infrastructure, like all pipeline infrastructure, it must be inspected. In many cases the pipelines from the natural gas storage wells to the main measurement regulating facilities do not have provisions to inspect the lines efficiently while under pressure or via inline with the media due to flow conditions, pipe fittings and lack of launch and receive facilities. Furthermore, given the criticality of the storage infrastructure, there are very tight outage windows to complete the pipeline inspections. Due to the inspection challenges, these systems are usually completed via a robotic crawler. This paper reviews the recent inline inspection campaign of a network system feeding a natural gas storage infrastructure, through detailed planning and pre job testing, the ability to efficiently and effectively utilize MFL combination tether technology to inspect the network in unprecedented time. Using tether technology, the 13-pipeline segment system, was inspected in under one week, which included multiple pipeline diameters, vertical launches, and short radius bends.
ILI Applications, “Unpiggable” inspections and technologies
80. Comparing Laser Scans Against In-Line Inspections and Quantifying Bias for Assessment Methods
NDT Global, Stutensee, Germany
Abstract
Ultrasonic technologies have been part of the portfolio of in-line inspection (ILI) vendors for decades, but many operators rely on magnetic flux leakage (MFL) technology when it comes to metal loss corrosion.
This case study is based on a 28” pipeline with external metal loss which was inspected using a MFL tool and – 5 years later – ultrasonic wall thickness measurement (UTWM) tool. This was followed by laser scans at 7 different sites which detected mostly pinholes and pitting corrosion. The number of verified anomalies allowed a statistical analysis of sizing deviations between ILI and field verifications. While most verifications happened after the UTWM inspection, a subset was completed shortly after the MFL inspection.
Detailed side-by-side comparisons between UTWM and the laser scans further illustrated the level of detail offered by direct measurement techniques. They provided in-depth insights on their advantages and limitations, as well as the influence of clustering strategies on length and width sizing accuracy.
Additional assessments in this pipeline led to the investigation of potential bias influencing the corrosion growth estimates. Utilizing subsets of features where no growth was expected, and by integrating the results from laser scans, this bias was quantified.
KEYWORDS FOR SUBJECT AREA: ultrasonic tools, magnetic flux leakage, metal loss corrosion, correlation, verification
81. Leveraging Multiple ILIs and Technologies to Identify Possible Integrity Threats Under Type A Sleeves
1Colonial Pipeline Company, 2Quest Integrity
Abstract
On August 14, 2020, a leak was discovered on Colonial Pipeline Company’s (Colonial) Line 1 pipeline in Huntersville, North Carolina. The release occurred at a dent, previously repaired with a Type A sleeve. Upon further investigation, it was found that external metal loss and a through-wall crack had developed in the dent sometime after the installation of the Type A sleeve. Type A sleeves are a common remediation method used to reinforce and repair certain anomalies on a pipeline. However, because the sleeve ends are not welded to the carrier pipe, Type A sleeves are not pressure-containing. A remediation plan to identify possible integrity threats under Type A sleeves and convert those Type A sleeves to pressure-containing Type B sleeves on Colonial’s mainlines was implemented.
In close conjunction, Colonial and Quest Integrity developed a plan to first identify every sleeve on Colonial’s mainlines. Once the comprehensive sleeve list was compiled, a qualitative analysis of all sleeve locations was initiated. Utilizing multiple inline inspections (ILI) and tool technologies, such as Ultrasonic Wall Measurement (UT-WM), Ultrasonic Crack Detection (UT-CD), and Combo (MFL + Caliper), each sleeve location was reviewed to determine:
Results from the sleeve review were used to provide a prioritization of the Type A to Type B conversions.
This paper uses case studies from this sleeve characterization and review project to show:
82. Use of Mobile Fleet of Leak Detection Devices to Mitigate Risk During Pipeline Repair Program
1Direct-C, Edmonton, Canada, 2Onebridge, Edmonton, Canada
Abstract
New IoT standalone leak detection systems can be rapidly deployed to cover potential leaks, however covering an entire pipeline is cost prohibitive so a method for selecting the locations for deployment is required.
This paper examines how data science & machine learning software combined with environmental assessments can lead to deployment of targeted leak monitoring devices that employ nanotechnolgy based coatings to optimize a pipeline repair program.
When a risk is noted on a pipeline, currently there is little recourse between doing an expensive direct assessment on that location; or letting that location remain unmonitored until resources exist to examine it. New IoT targeted leak detection technology allows an economical middle ground where many risk locations can be monitored for minute traces of signs of a leak, all at a fraction of the price of a direct assessment. With such timely alerting of a leak, the consequences at that site can be greatly reduced. These leak detectors only work in a very localized area and depend on areas of concern being accurately identified. It is modern, advanced ILI alignment and integrity analysis software that provides this key risk placement data.
This leak detection technology uses smart coatings to detect Hydrocarbons, it runs 24/7 and uses alarm-based algorithms to alert to the presence of leaks. It can be rapidly installed in targeted locations that are identified by algorithms as being needed to be repaired and then moved to new locations as those identified defects are repaired.
This paper describes how a fleet of leased mobile leak detection systems were deployed over several months along a pipeline which covered several US States. The units were deployed in High-risk areas that had been identified as needing repair. At the completion of the repair program most of the leased leak detection systems were returned. Feedback from the operator will be included in the presentation.
83. Composite Repairs Evaluation for Axial and Bending Loads to Simulate Girth Welds Under Risk of a Geohazard Event
CSNRI, Houston, USA
Abstract
Pipelines are exposed to environmental induced damage due to corrosion, erosion, and potential Geohazard activities that include earthquakes, floods, landslides, and any other geological or hydrological disasters. These activities could threaten a pipeline’s structural integrity. This paper will focus on geohazard risks as the consequences and risks are generally higher and more immediate than that of wall-loss type defects.
Repair of damaged pipelines has traditionally been accomplished using welded repairs, where a patch material is attached to the substrate over the damage. During the past twenty years, composite materials used to repair damaged pipelines have experienced a considerable increase as these repairs have become more cost effective, efficient, and reliable due to extensive testing.
This paper will focus on describing a test program to evaluate the performance of a composite repair under bending or axial loads to simulate the impact of a potential Geohazard. These repaired specimens will be tested in different configurations of installation pressure, internal pressure cycling and axial force cycling. On this test program, a composite repair was installed on 12-in pipe where an internal local notch (50% deep and 6” on the hoop direction) was installed at the weld to simulate lack of fusion or represent a poor quality weld. Testing results show that a composite repair is capable of considerably reducing strains at the weld and increasing the axial and bending load capacity of the carrier pipe.
Keywords: Composite Repair, Geohazards
84. New Repair Technology – the Path to Field Deployment
Pipe Spring LLC, The Woodlands, USA
Abstract
Pipe Spring™ technology utilizes the well know material properties of steel with the installation methods and techniques associated with various composite repair products. Thin layer steel is utilized to wrap around the pipe and secured via modern toughened adhesive to fabricate a non-welded steel sleeve. This method removes the long -standing concerns regarding the vast material property differences between steel and various composite architectures and constituent components. It also eliminates welding. This paper will address US DOT, PHMSA regulatory requirements of repair methods. The paper will provide a brief review of the full-scale validation testing completed following ASME PCC-2 guidance. MFL based ILI inspection of the sleeve is reviewed. Data from two ILI service providers will be reviewed. This paper discusses field crews, installation methods and the training and documentation required to satisfy Operator Qualification (OQ) requirements. The simplicity and facility of installations is discussed based on actual operator training efforts.
Key Words: Emerging issues/technology. Repairs and Rehabilitation
85. Going Above and Below – Material Property Verification Documentation Review
1ROSEN, Columbus, USA. 2ROSEN, Houston, USA. 3NiSource, Hammond, USA
Abstract
The introduction of regulatory changes by PHMSA in 49 CFR 192, for Traceable, Verifiable and Complete (TVC) pressure test and material property records meant that pipeline operators have had address their systems of record. The challenge is to determine the status of existing documentation for all pipe and components in pipelines, pipeline subsystems, and metering & regulating stations.
Reviewing, aligning, interpreting, and managing the significant amount of data and documentation accumulated over the history of these networks presents a challenge. Processes and specifications have been established to ensure that historical records are treated correctly and consistently in the context of regulatory language. Once extracted, the data is integrated into auditable systems of record, which can be easily visualized to support and facilitate programs for regulatory compliance and Integrity Management.
This paper will present a summary of the processes and applications that a partnership between the operator and engineering consultancy has implemented to surmount these challenges, including document management, Geographical Information Systems (GIS) and geospatial analysis, in-field verification for stations, and quality control methods. Commentary will be provided on the treatment of historical records in the context of the new regulatory requirements, where interpretation is often required. Finally, a discussion on how operators can use these systems and processes to inform and implement strategies for MAOP reconfirmation and material verification will also be provided.
85. Know your Materials! On-site Non-Destructive Materials Testing for Gas Transmission Pipelines
1SMUD, Sacramento, USA. 2Massachusetts Materials Technologies LLC, Natick, USA
Abstract
The new Mega Rule now requires pipeline operators to have Traceable, Verifiable and Complete (TVC) material records for their pipeline systems. Operators that do not have TVC records for any portion of their pipeline, must develop and implement procedures for non-destructive testing (NDT), destructive testing, examinations and assessments in order to verify these material properties for above ground line pipe and components, and of buried line pipe and components. Because of the recent ruling, Sacramento Municipal Utility District (SMUD), an operator of 76 miles of gas transmission pipeline, recently contracted Massachusetts Materials Technologies (MMT) to conduct three in-situ pipeline evaluations where they implemented positive material identification (PMI) technologies to verify and confirm the pipeline hardness, strength and ductility (HSD) properties for their pipeline. Massachusetts Materials Technologies (MMT) performed this work in compliance with [49CFR192.607]. MMT’s proprietary equipment and test procedures were able to predict pipeline yield strength, ultimate tensile strength, base metal chemical composition characteristics, and pipeline hardness to show material ductility. The technologies also gathered hardness data across the long seam weld to classify the pipe seam weld type. MMT was validated within the industry and selected based on the results of PRCI NDE 4-8 report (Catalog No. PR-335-173816). The destructive test method data attained from SMUD’s original heat analysis, further confirmed the predicted values MMT acquired for each material grade that was investigated at each site. MMT’s predicted test results were found to be conclusive, aligning closely with SMUD’s original pipeline Material Test Reports (MTR’s). This NDT method has further validated SMUD’s original pipe material records and should be considered by pipeline operators that are looking for a proven technology and test method to help confirm pipe populations that do not have TVC records.
86. Pipe Grade Classification: Groundbreaking ROI From Your UHR MFL Inspection
Entegra, Reading, United Kingdom
Abstract
Operators must be able to see more and know more about the overall condition of their pipelines to keep their operations running safely and efficiently. This paper will show why the delivery of a complete and accurate Materials Classification Report is one of the most significant outcomes of employing the latest in UHR MFL technology.
This paper will take a holistic look at Ultra-High Resolution MFL and how a system incorporating the latest in UHR technology, combined with human-experience based data analysis, can provide an integrity assessment that goes well beyond POD and POI. Understanding the impact of pipe grade, maximum operating pressures, current and projected metal loss and the accurate and cost-efficient confirmation of historical pipeline data are all benefits of a truly integrated system of technology and data analysis.
We’ll look at these factors as well as how they relate to the Mega Rule and its impact on an operator’s ability to maximize throughput, ROI and pipeline integrity.
87. Validating and quantifying in situ NDT uncertainty of line pipe material properties
1Exponent, Inc., Houston, USA. 2RSI Pipeline Solutions, New Albany, USA. 3Exponent, Inc., Menlo Park, USA. 4PG&E, Walnut Creek, USA
Abstract
The federal rules governing the operation of natural gas pipelines allow operators to use nondestructive testing (NDT) technologies to verify pipeline material properties provided that these tools are validated against destructive test results and conservatively account for measurement inaccuracy and uncertainty. Any measurement methodology inherently has uncertainty due to both systematic and random effects: systematic errors being those that remain constant during repeated measurements, and random errors being those that vary randomly in repeated measurements. This combined uncertainty not only affects the estimation of material properties, but it may also propagate to downstream analyses, such as during maximum allowable operating pressure (MAOP) reconfirmation. Moreover, this uncertainty might adversely affect the accurate determination of comparable pipe segments when establishing sampling populations.
This paper presents Pacific Gas and Electric Company’s (PG&E) approach for the statistical inference of destructive laboratory values when in situ (field) NDT measurements are collected. This approach has been formulated from an in-house statistical validation of NDT technologies whereby NDT measurement results are compared against laboratory destructive test results. The types of material properties that PG&E has evaluated using NDT technologies include microstructure, hardness, chemical composition, yield strength, and ultimate tensile strength. In total, several thousand NDT measurements across approximately one-hundred pipe features have been evaluated against laboratory test results. The authors describe this statistical analysis approach whereby the lab results are compared to NDT measurements through a regression model to account for systematic errors. Once the regression is performed, the scatter of the data is quantified using a prediction interval to account for the random portion of the uncertainty. Finally, the total uncertainty is quantified and propagated to downstream analyses using a Monte Carlo methodology. Current challenges to this approach are presented, and alternate statistical approaches are described which have the possibility of yielding additional benefits.
88. Axial Flaw and Crack Detection in Multi-diameter Low-Pressure Gas Pipelines
1ROSEN, Houston, USA. 2LG&E, Louisville, USA
Abstract
Louisville Gas and Electric (LG&E) owns and operates numerous natural gas transmission pipelines in the greater Louisville, KY area. Many were constructed during the 1950’s and therefore present extensive challenges to inline-inspection (ILI) efforts. Multi-diameter pipeline geometry and transient operating conditions combine to create an environment that proves difficult for running in-line inspection tools. LG&E has utilized high resolution geometry and metal loss detection solutions optimized for low-pressure multi-diameter pipelines ILI devices in their integrity management program. There was a desire to expand the technologies deployed to include technologies best capable of detecting axially oriented anomalies and cracking. To address these concerns, circumferentially induced magnetic flux leakage (MFL-C) and electromagnetic acoustic transducer (EMAT) technologies were suggested, however applying these detection methods in low-pressure multi-diameter pipelines was not available.
MFL-C & EMAT-C ILI devices capable of inspecting a pipeline with both 16″ and 20″ diameters in a low-pressure gaseous environment needed to be developed. In addition, traversal of all restrictive features, such as tight radius bends and minimal spacing between fittings, must be achieved with minimal differential pressure to facilitate stable run behavior and allow optimal data capture. ROSEN reviewed all known details regarding the targeted pipelines and compiled a list of challenging fittings to define the required mechanical passage capabilities. The conceptual design, manufacturing, and assembly stages of development resulted with redesigned low-friction ILI tools capable of full circumferential sensor coverage in 16″ – 20″ pipeline diameters. The tools were then pumped with water through a test loop that included the most restrictive features identified in the targeted pipelines. Performance results confirmed mechanical passage and determined the average ∆P’s necessary to pass the included restrictive features. Finally, validation pull tests occurred to confirm data capture functionality within established specifications. After mechanical and data capture performance were verified, the new low pressure multi-diameter 16/20″ MFL-C & EMAT-C were deemed fit for service and deployment.
This technical paper outlines the development process with examples and observations from the testing program. Difficulties related to MFL-C & EMAT-C technologies as related to low-pressure and multi-diameter environments are discussed in further detail. The paper includes real-world operational challenges and inspection results from two successfully inspected pipelines, as well as a discussion of iterative ILI tool improvements.
89. Detection and Sizing of Selective Seam Weld Corrosion Using Axial and Circumferential MFL Micron ILI Technology
Novitech Inc., Vaughan, Canada
Abstract
This research and development are for the purpose of optimizing an In-line inspection (ILI) system for the detection, characterization, and sizing of selective seam weld corrosion (SSWC). This technology utilises both Axial Flux Leakage (AMFL) and Circumferential Magnetic Flux Leakage (CMFL) measuring systems. The technology is also designed to take up to 1,600 readings per square inch providing the required resolution to detect and size SSWC.
This paper will present several phases of the study that include conceptual development, pull testing, and field verification from live runs on pipeline systems containing SSWC. It includes the development of software and analysis tools that utilize varying signal responses to both AMFL and CMFL for different metal loss geometries.
The evaluation of SSWC, and of general corrosion coinciding with the long seam weld area, requires both AMFL and CMFL ILI data that has been collected with very high resolution. This research shows that field-tool correlation improves when the process of characterization and sizing SSWC is carried out in the following three steps:
1. The use very high-resolution data to better delineate SSWC from within the general corrosion area, and to provide precise positioning of the long seam weld.
2. Determine whether the long seam corroded areas exhibit wedge, groove, or axial slot like shapes that are typical of SSWC. These features are frequently in aeras of significant corrosion adding to the complexity of characterization and sizing.
3. Apply both AMFL and CMFL sizing algorithms to the preselected SSWC locations to properly size axially orientated wedge or groove-like features.
This paper will also illustrate additional challenges found during field verifications. These include the occurrences metal loss coinciding with seam flaws such as lack of fusion and hook crack flaws, and the current development of analysis tools that address these compounded flaws that can, on occasion be misclassified as SSWC.
89. Pathfinder Foam Caliper Pig Overcomes Severe Pipeline Conditions to Successfully Identify and Locate Geometric Deformations in Gas Pipeline, Mainland China
¹Pipeline Innovations Ltd, Cramlington, UK
Abstract
OBJECTIVE/SCOPE
This paper is to share the development of Self-Propelling Robotic In-Line Inspection technology that PETRONAS embark as OPEX optimization for un-piggable pipeline. Lack of conventional inspection methods to inspect un-piggable pipelines such as vent pipelines without pig traps facility and low flow pipelines, has prompted PETRONAS to embark on technology development journey for Self-Propelling Robotic ILI.
METHODS/PROCEDURES
The development of the Self-Propelling Robotic In-Line technology consists enhancement of robotic tethered crawler tool to a wireless robotic tool, testing and validation using actual full scale fabrication test loop. Fabricated test loop includes horizontal and vertical section with bends of 1.5D to simulate the inspection tool travel as per actual site condition representing vent line.
The enhancement consists of wireless connection range, optimum speed and distance, movement of slippery surface which grease was applied on the vertical section and emergency extraction of inspection robot.
RESULTS/OBERVATIONS/CONCLUSIONS
Robotic ILI qualification test which was successfully met PETRONAS requirement based on full scale factory acceptance test. The test was focused and able to meet below success criteria: –
Robotic ILI tool able to self-propel on vertical test spool.
Robotic ILI tool able to move with wireless connection for the intended travel length.
Emergency retrieval tool procedure and mechanism in the event of faulty robotic ILI or loss of connection.
Sensor detection capability at POD 90% and POI 80%.
Based on the evaluated technology, Robotic ILI solution is feasible in ascertaining the un-piggable pipeline integrity and recommended solution to tackle high operational costs that upstream operators face when inspecting their pipelines using current available methods. Deployment of this technology is estimated to provide up to 30% OPEX optimization.
The technology has been evaluated to be technically ready and pilot tested PETRONAS asset which will be shared in our detail paper covering below areas:
1. Robotic ILI tool able to travel successfully total length of pipeline.
2.Detection capability at POD 90% and POI 80% for anomalies covering metal loss and girth weld anomales.
NOVEL/ADDITIVE INFORMATION
Current approach to inspect un-piggable vent or low flow pipeline is Crawler ILI type technology which propelled by umbilical cable whereby the pipeline requires to be in shutdown mode. While, inspection using Self-Propelling Robotic ILI can be applied for un-piggable pipeline i.e. low flow pipeline and vent line with short duration or no requirement of shutdown.
90. High-resolution crack inspection of gas pipelines using guided wave technology
NDT Global, Bergen, Norway
Abstract
Gas transmission lines, especially those which were built from mid-20th century to the early 1980s are sometimes affected by stress corrosion cracking (SCC). A common methodology to address this threat is to utilize EMAT ILI tools to characterize the asset and flaws.
A magnetic flux leakage tool (TFI) is typically used in addition to the EMAT inspection to improve characterization of features. Furthermore, the resolution and maximum wall thickness to operate those EMAT tools are limited as of today.
NDT Global has developed an alternative technology which addresses crack diagnostics in gas pipelines. This development is based on directional gas-coupled guided wave generation in the pipe wall. This allows inspection of the asset without contact between transducers and the pipe wall. The small size of the transducers allows for a high density measurement grid. This directly translates into higher resolution and highly accurate data, enabling improved detection, identification and sizing of SCC features and other linear imperfections. These developments will significantly improve pipeline safety for systems subjected to SCC.
The authors will present the history of the development, starting with a gap analysis of existing solutions, some working hypothesizes to overcome those gaps followed by simulations, and test results from full-scale tests. These tests have been completed in Q4 2022.
The development was performed in close collaboration with a North American pipeline operator. The authors will present the results of the validation of the technology.
91. Inline Inspection Monitoring and Data Interpretation Using Fiber-Optic Sensing
1Schlumberger Midstream Production Systems, Dubai, UAE 2Schlumberger Midstream Production Systems, Houston, USA 3Midstream Integrity Services, San Antonio, USA 4Schlumberger Midstream Production Systems, London, UK
Abstract
Fiber-optic sensing systems are becoming more commonly used for leak and third-party intrusion detection on pipeline infrastructure throughout the world. This has been recognized by their recent inclusion in the latest editions of API 1130 and API RP 1175. Sensing systems also have a part to play in the operational aspect of pipeline management. This includes the monitoring of most pipeline pigs, ranging from typical batching or cleaning pigs that may be run frequently to the critical inline inspection tools that inspect pipelines less frequently.
Early adopters of fiber-optic distributed acoustic sensing (DAS) systems discovered that these solutions could identify the location of pigs as they traversed the pipeline as well as pinpoint the location of a stuck pig, enabling the pipeline operator to immediately take action to dislodge the stuck tool and even mobilize to the location to remove the pig through intervention. The latest evolution of DAS from qualitative to quantitative data means that the information gathered is richer, and the greater fidelity results in more precise and certain feedback for the operator.
This paper focuses on operational pigging data gathered by Midstream Integrity Services for a 720-mile pipeline in Texas and confirms that fiber-optic sensing can support and complement routine operational pigging as well as intelligent pigging by removing the risk and inaccuracy associated with traditional pig tracking methodology.
92. INGAA’s EMAT Technical Guidance Document Knowledge Transfer
D2 Integrity, Houston, USA
Abstract
The INGAA Foundation formed a joint industry project (JIP), on behalf of INGAA, to develop an industry technical guidance document specific to the use of Electromagnetic Acoustic Transducer (EMAT) in-line inspection technology for management of cracks, with specific emphasis on stress corrosion cracking (SCC). EMAT ILI has been used for over two decades and has reached a level of maturity where both the performance specifications and response planning can be systemized. However, the use of EMAT has mostly been limited to early adopters and requires implementation of processes and procedures particular to EMAT for it to be used as an integrity assessment. With recent changes to gas pipeline regulations in 49 CFR 192 associated with integrity assessments and MAOP Reconfirmation, the use of EMAT ILI for crack management is expected to increase by new and existing users. This technical guidance document was developed to benefit industry from the experience of the JIP members and provide knowledge sharing. This presentation will provide a knowledge transfer on this subject through an overview of how to use the published guidance document and the lessons learned from its development.
93. EMAT Lessons Learned Using Direct Assessment Findings
1T.D. Williamson, Salt Lake City, USA. 2Pacific Northern Gas, Terrace, Canada. 3Pacific Northern Gas, Vancouver, Canada
Abstract
Different cracking mechanisms can potentially affect pipelines depending on the operating conditions, product, coating type, pipe manufacturing process, and environment. These mechanisms include manufacturing-related crack-like linear indications (e.g., seam weld lack of fusion, subsurface or surface breaking laminations), construction-related cracks (e.g., girth weld cracks, in-service fillet weld toe cracks), cracks formed in mechanical damages, and environmentally assisted cracking (EAC). One of the most important forms of EAC relevant to pipeline structures is stress corrosion cracking (SCC) that has been of particular focus in the past two decades.
Due to the severe consequence of linear indication-related pipeline failures and nonlinear growth and propagation of specific types of linear indication integrity threats, pipeline operators continuously push for new technologies, methods, and procedures for assessing and mitigating pipeline integrity risks pertaining to crack and crack-like anomalies. Inline inspection (ILI) is proven as one of the most effective means that leads to significant improvement in the integrity management of these threats. A key ILI technology that has proven useful for the detection, classification, and sizing of gas pipeline crack and crack-like features is Electromagnetic Acoustic Transducer (EMAT) technology.
Understanding how technologies works and how their performance can be improved is of essence to the success of an ILI-based integrity management program. This article will present and discuss Pacific Northern Gas Ltd. (PNG), and T.D. Williamson (TDW) lessons learned, challenges, and successes of utilizing EMAT ILI technology to identify, classify, quantify, and mitigate crack and crack-like integrity threat risks across multiple gas pipeline systems. Utilizing an EMAT system, populations of anomalies will be reviewed and compared with direct assessment findings. Recommendations and potential mitigation strategies will also be presented.
Keywords: cracks, deformation, electromagnetic acoustic transducer, environmentally assisted cracking, gas pipeline, geometry, inline inspection, magnetic flux leakage, metal loss, Multiple Dataset, pipeline integrity, stress corrosion cracking, , DEF, EAC, EMAT, GEO, ILI, LFM, MDS, MFL, SCC, SMFL
94. Enhancing EMAT Crack Detection Services Using State of the Art Deep Learning
1Rosen EU, Lingen, Germany. 2Rosen USA, Houston, USA
Abstract
EMAT crack detection technology is used worldwide by many oil and gas operators to detect and size cracks in liquid and gas pipelines. By collecting data of increasingly higher resolution and quality, it is possible to achieve a more and more accurate representation of the integrity reality of oil and gas structures.
However, the prerequisite for gaining insights from this data is provided by Artificial Intelligence (AI) methods and a corresponding Research-First structure of a company. The AI division at ROSEN Research Center invested significant time and resources to apply powerful machine learning in particular Deep Learning methods to ensure timely and accurate inspection results delivered to operators. These efforts are directed towards building data driven applications to ensure reliability of inspection systems. Supported by a modern data engineering infrastructure, AI-powered data-driven applications can be used to enhance both the quality and efficiency of inspection data analysis.
This paper will provide an insight on how ROSEN uses AI-methods to enhance classification and sizing of metal-loss and crack indications in pipeline inspection data. Particularly, how Deep Learning methods help ensuring the quality of EMAT-Crack detection services.
KEYWORD(S) FOR SUBJECT AREA: Machine Learning, EMAT Technology
Use Your Layers Wisely – Composite Repair of SCC
1ADV Integrity, Inc., Waller, USA. 2Williams, Salt Lake City, USA. 3CSNRI, Houston, USA
Abstract
Composite repairs have been traditionally utilized as a means to repair features identified on pipeline systems including corrosion and dents. Recently, several industry-based studies have been performed to investigate the repair of longitudinal cracks and crack-like features. These studies demonstrated the ability to reinforce crack and crack-like indications, however, were reinforced with overdesigned repair thicknesses. While this is conservative, additional layers increase cost and complexity of the repair.
This study utilized nominal API 5L, Grade X52, 10-inch OD x 0.188-inch WT pipe removed from the field containing actual SCC indications to fabricate four full-scale test samples. Thicker pup extensions were utilized to ensure a higher stress level within the portion of pipe containing the SCC indications. The SCC indications present had a max interconnecting length of 16 inches and a maximum depth of 68% of the wall thickness.
Varying repair thicknesses were installed to further investigate the ability of a carbon fiber composite repair system to reinforce SCC indications of varying lengths and depths. Additionally, one sample was repaired while under pressure. To accomplish a comparison between samples, several criteria were compared: the ability to survive full-scale pressure cycling and subsequent burst test, a reduction in strain measured across repaired crack-like indication using a uniaxial strain gage, and any subsequent growth identified after completion of the full-scale tests. All cracks were broken open after testing to confirm starting and final crack depth.